
|
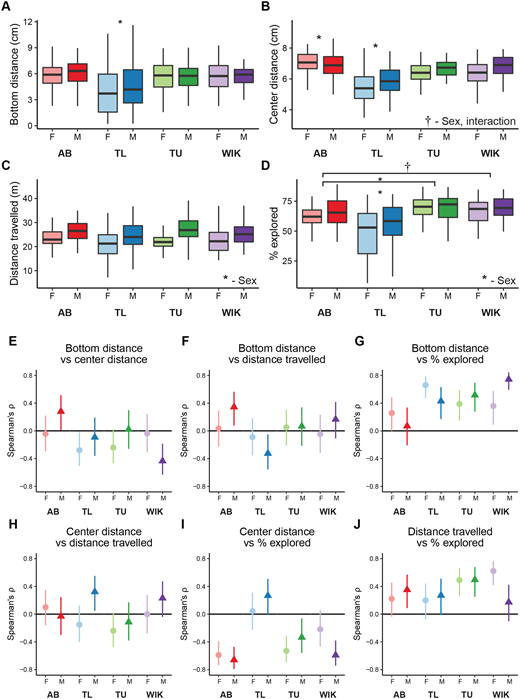
Fig. 2
Influence of sex and strain on individual exploratory behaviors. The effect of sex and strain on (A) bottom distance, (B) center distance, (C) distance travelled, and (D) percent of the tank explored. Boxplots indicate median (center line), interquartile range (box ends), and hinge±1.5 times the interquartile range (whiskers). Spearman's rank correlation coefficient (ρ) with 95% confidence intervals across strain and sex for (E) bottom distance versus center distance, (F) bottom distance versus distance travelled, (G) bottom distance versus percent explored, (H) center distance versus distance travelled, (I) center distance versus percent explored, and (J) distance travelled versus percent explored. *P<0.05, †P<0.10 compared to all other groups or those indicated. AB, female: n=58, male: n=52; TL, female: n=54, male: n=50; TU, female: n=58, male: n=50; WIK, female: n=51, male: n=53.