
Image
|
Figure Caption
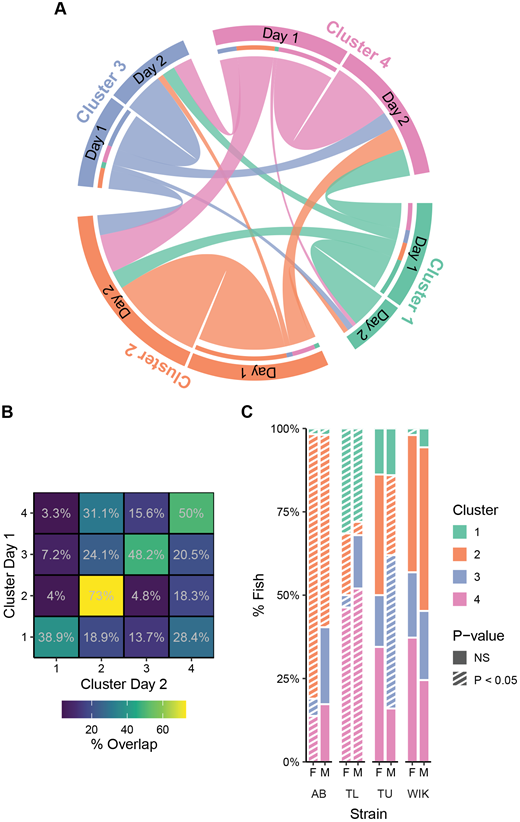
Fig. 4
Clusters across two consecutive exposures to the tank. (A) Chord diagram indicating how cluster membership changes from day 1 to day 2 of novel tank exposure. (B) Percent overlap for each cluster from day 1 to day 2. (C) Percentage of fish that fall into each cluster across strain and sex on the second day of exposure to the novel tank. Striped bars (P<0.05) represent over/under representation using randomized permutation tests and FDR corrections. AB, female: n=58, male: n=52; TL, female: n=54, male: n=50; TU, female: n=58, male: n=50; WIK, female: n=51, male: n=53.
Acknowledgments
This image is the copyrighted work of the attributed author or publisher, and
ZFIN has permission only to display this image to its users.
Additional permissions should be obtained from the applicable author or publisher of the image.
Full text @ Biol. Open