
- Title
-
A regeneration-triggered metabolic adaptation is necessary for cell identity transitions and cell cycle re-entry to support blastema formation and bone regeneration
- Authors
- Brandão, A.S., Borbinha, J., Pereira, T., Brito, P.H., Lourenço, R., Bensimon-Brito, A., Jacinto, A.
- Source
- Full text @ Elife
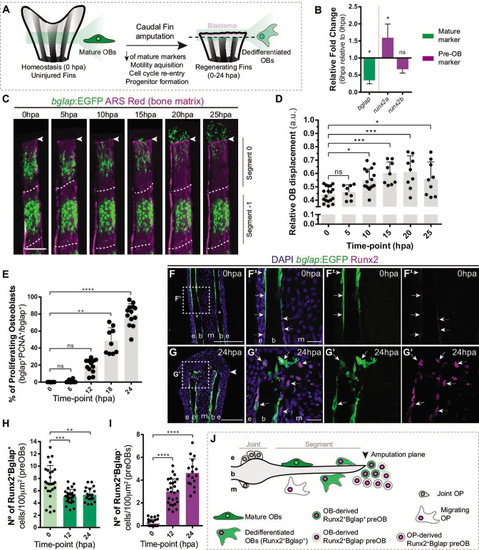
Osteoblast dedifferentiation time-window during caudal fin regeneration. (A) Biological traits of OB dedifferentiation process. (B) Relative gene expression of mature (green) and pre-OB (magenta) markers, at 6 hpa relative to 0 hpa. Statistical analysis on graph corresponds to paired t-test with Welch’s correction. Mean ± SD are displayed (n=4 biological replicates). (C) Live imaging analysis of OB motility in bglap:EGFP fish (green) during the first 25 hpa, highlighted in the segment bellow amputation (segment 0) and segment –1. Bony-rays are labeled with Alizarin red (magenta). White dashed lines delineate the intersegment region. (D) Quantification of the relative OB displacement in segment 0. Statistical analysis displayed on graph corresponds to Kruskal-Wallis test with Mean ± SD (n=9–18 bony-rays). (E) Percentage of proliferating OBs through immunofluorescence against PCNA in bglap:EGFP fish. Statistical analysis displayed on graph corresponds to Kruskal-Wallis test with Mean ± SD (n=9–13 cryosections). (F-G’) Representative cryosection images of bglap:EGFP (green) fins immunostained for Runx2 (magenta) and counterstained with DAPI (blue), in (F, F’) uninjured fish and (G, G’) at 24 hpa; arrows indicate Runx2 +Bglap + cells and dashed arrows indicate Runx2 +Bglap cells. (H, I) Quantification of (H) Runx2 +Bglap + and (I) Runx2 +Bglap cells during the first 24hpa. Statistical analysis displayed on graph corresponds to Mann-Whitney test with Mean ± SD (n=18–27 cryosections). (J) Cellular sources that contribute for new pre-OBs formation after injury include mature osteoblasts and potentially joint OP. White arrowhead indicates amputation plane and dashed squares represent magnified panels in F’ and G’. E: epidermis; b: bone; m: mesenchyme; ns: not significative; *p<0,05; **p<0,01; ***p<0,001; ****p<0,0001. Scale bars represent 100 µm and 30 µm in magnified panels. See Figure 1—source data 1.
|
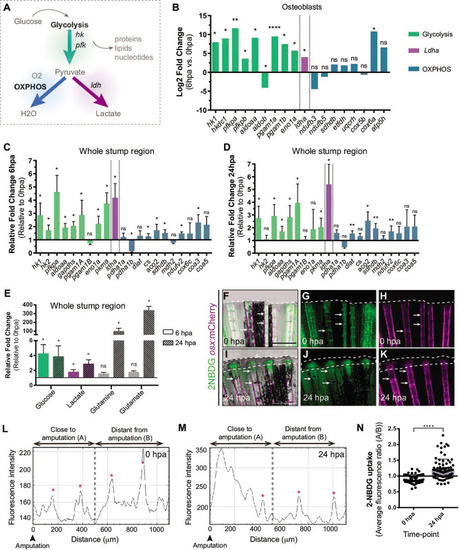
(A) Schematic representation of glucose metabolism. (B) OB gene expression profile of glycolytic enzymes (green), ldha (magenta) and OXPHOS components (blue) at 6 hpa relative to uninjured conditions (0 hpa) obtained from the OB ArrayXS. The horizontal axis represents the log2 fold-change and p-values on a negative log10 scale. Statistical analysis with t test and Welch’s correction (n=3 biological replicates), Mean ± SD are displayed. (C, D) Relative gene expression of glycolytic enzymes (green), ldha (magenta) and OxPhos components (blue), in the whole fin stump, at (C) 6 hpa and at (D) 24 hpa in comparison to uninjured conditions (0 hpa). Statistical analysis with paired t test (n=5 (C) and 4 (D) biological replicates). (E) Metabolite measurements at 6 hpa (clean columns) and 24 hpa (stroked columns) in relation to uninjured conditions (0 hpa), in the whole fin stump. Statistical analysis with Mann-Whitney test (n=4 biological replicates). (F–K) Live imaging of 2NDBG uptake (green) in osx:mCherry fish (magenta) at (F–H) 0 hpa and (I–K) 24 hpa. Arrows indicate uptake of 2NBDG in the intersegment regions. White dashed line delineates the regenerated tissue. Scale bar represents 500 µm. (L–M) Intensity of 2NBDG uptake in regions close and distant to the amputation site, at (L) 0 hpa and (M) 24 hpa. Red * indicate peaks of 2NDBG uptake in the intersegments. (N) Ratio of 2NBDG uptake at 0 hpa and 24 hpa. Statistical analysis on graph corresponds to Mann-Whitney test. Mean ± SD are displayed (n=54 and 83 bony-rays). ns: not significative; *p<0,0001. See Figure 2—source data 1. |
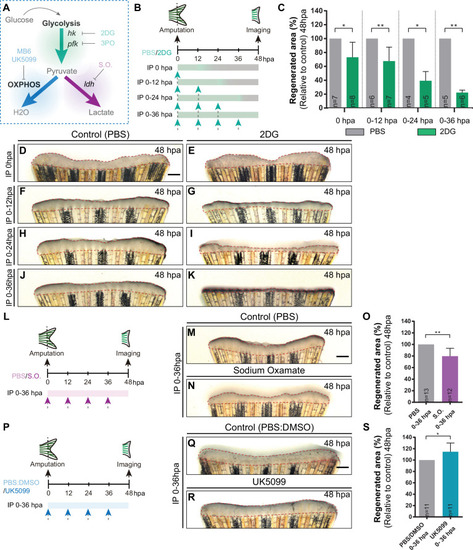
(A) Schematic representation of the compounds used to manipulate glucose metabolism. (B) Experimental design used to inhibit the glycolytic influx during fin regeneration. Control and treated fish are administered, via IP injection, with vehicle (PBS) or glycolytic inhibitor, 2DG, respectively, every 12 hr, from fin amputation (0 hpa) until 48 hpa. Different time-intervals were used for injections: (0 hpa) IP injection at (0 hpa; 0–12 hpa) IP injection at 0 and 12 hpa; (0–24 hpa) IP injection at 0, 12, and 24 hpa; (0–36 hpa) IP injection at 0, 12, 24, and 36 hpa. (C) Quantification of the total fin regenerated area at 48 hpa, after vehicle (PBS) or 2DG injection, at specific time-intervals during regeneration. (D–K) Representative images of 48 hpa fins treated with (D,F,H,J) vehicle (PBS) or (E,G,I,K) 2DG during different time-intervals. (L) Experimental design used to inhibit the lactate formation during fin regeneration. Fish are administered, via IP injection, with vehicle (PBS) or S.O. every 12 hr, from fin amputation (0 hpa) until 48 hpa. (M, N) Representative images of 48 hpa caudal fin treated with (M) vehicle (PBS) or (N) S.O. (O) Quantification of the total fin regenerated area at 48 hpa, after vehicle (PBS) or with S.O. injection. (P) Experimental design used to inhibit pyruvate translocation to mitochondria during fin regeneration. Fish are administered, via IP injection, with vehicle (PBS) or MPC inhibitor, UK5099, every 12 hr from fin amputation (0 hpa) until 48 hpa. (Q, R) Representative images of 48 hpa fins treated with (Q) PBS:DMSO (control) or (R) UK5099. (S) Quantification of the total fin regenerated area at 48 hpa, after vehicle (PBS) or with UK5099 injection. For all graphs, statistical analysis corresponds to Mann-Whitney test with Mean ± SD, sample number is displayed on each column and corresponds to single fish. Scale bar represents 500 µm. Dashed lines define the regenerated tissue. * p<0.05, ** p<0.01. See Figure 3—source data 1. |
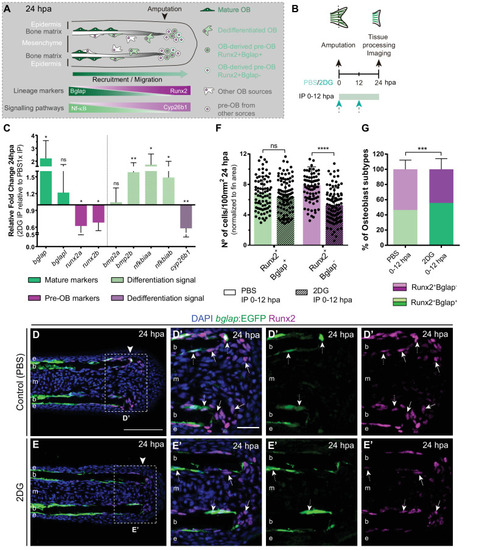
(A) Schematic representation of pre-OBs formation during regeneration. Pre-OBs arise from OB dedifferentiation and potentially from the joint OP niche. OB dedifferentiation is correlated with inactivation of NF-ΚB and increase in Cyp26b1 activity. (B) Experimental design used to inhibit glycolysis. Fish are administered, via IP injection, with vehicle (PBS) or 2DG, from fin amputation (0 hpa) until 24 hpa. (C) Relative gene expression of mature and pre-OBs markers, and differentiation and dedifferentiation pathways, in the whole fin stump at 24 hpa, in 2DG treated fins compared to control condition (0 hpa). Statistical analysis with paired t-test (n=10 biological replicates). (D-E’) Representative cryosection images of 24 hpa bglap:EGFP (green) caudal fins immunostained for Runx2 (magenta) and counterstained with DAPI (blue), in fish treated with (D,D’) vehicle (PBS) or (E,E’) 2DG. White dashed boxes delineate magnified panels in D’ and E’. Arrows indicate Runx2 +Bglap cells. Dashed arrows indicate Runx2 +Bglap + cells. Arrowhead indicates amputation plane. E: epidermis; b: bone; m: mesenchyme. Scale bar represents 100 µm and 30 µm in magnified panels. (F) Total number of Runx2 +Bglap + and Runx2 +Bglap cells per area at 24 hpa. (G) Percentage of Runx2 +Bglap + and Runx2 +Bglap OBs subtypes. Statistical analysis displayed on each graph corresponds to Mann-Whitney test with Mean ± SD (n=79 (PBS) and 89 (2DG) cryosections). ns: not significant; ** p<0.01; *** p<0.0001. See Figure 4—source data 1. |
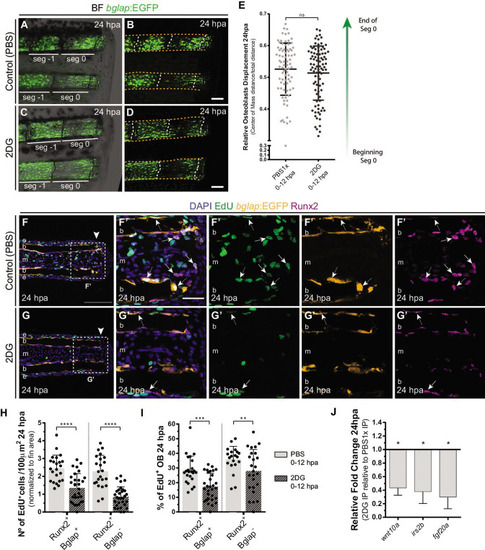
(A–D) Representative images of bglap:EGFP caudal fins at 24 hpa, treated with (A–B) vehicle (PBS) or (C–D) 2DG. Double white arrows indicate the anterior (A) and posterior (P) axis. White dashed lines indicate intersegment regions. Orange dashes lines delineate the bony-ray surface. (E) Measurement of relative OB displacement along segment 0, below the amputation plane, at 24 hpa in fins treated with vehicle (PBS) or 2DG. Statistical analysis on graph corresponds to Mann-Whitney test with Mean ± SD (PBS = 90, 2DG = 82 bony-rays). (F-G’) Representative cryosection images of 24 hpa bglap:EGFP (orange) caudal fins immunostained for Runx2 (magenta), labeled with EdU (green) and counterstained with DAPI (blue), in fish treated with (F) control (PBS) or (G) 2DG. Dashed boxes delineate amplified panels in F’ and G’. Arrows indicate proliferative EdU +Runx2+Bglap cells. Dashed arrows indicate proliferative EdU +Runx2+Bglap + cells. Arrowhead indicates amputation plane. Scale bar represents 100 µm and 30 µm in amplified panels. (H) Total number of Runx2 +Bglap + and Runx2 +Bglap cells at 24hpa, in fins treated with vehicle (PBS) or 2DG. (I) Percentage of proliferative Runx2 +Bglap + and Runx2 +Bglap cells at 24hpa, in fins treated with vehicle (PBS) or 2DG. Statistical analysis displayed on each graph corresponds to Mann-Whitney test with Mean ± SD (n=23–30 cryosections). (J) Relative gene expression at 24 hpa in 2DG treated fins, compared to control. Statistical analysis with unpaired t test and Welch’s correction (n=5 biological replicates). ns: not significant; *p<0.0001. See Figure 5—source data 1. |

(A) Experimental design used to inhibit glycolysis. Fish are administered, via IP injection, with control (PBS) or 2DG every 12 hr, from fin amputation (0 hpa) until 48 hpa. (B) Schematic representation of the distribution of OBs subtypes along the blastema. (C–D) Representative cryosection images of 48 hpa osx:mCherry (green) caudal fins immunostained for Runx2 (magenta) and counterstained with DAPI (blue), in fish treated with (C,C’) PBS and (D,D’) 2DG. Dashed boxes represent magnified panels in C’ and D’. Arrows indicate Runx2 +Osx- pre-OBs. Dashed arrows indicate Runx2 +Osx + immature OBs. (E–F) Total number of (E) Run2 +Osx and (F) Runx2 +Osx + subtypes in 48 hpa fins treated with PBS or 2DG (PBS = 27, 2DG = 25 cryosections). (G) Percentage of Runx2+/Osx- and Runx2 +Osx + subtypes in 48 hpa fins treated with PBS or 2DG. (H-I’) Representative cryosection images of 48 hpa osx:mCherry (orange) caudal fins immunostained for Runx2 (magenta), EdU (green) and counterstained with DAPI (blue), in fish treated with (H,H’) PBS and (I,I’) 2DG. Dashed boxes represent magnified panels in H’ and I’. Arrows indicate proliferative Edu +Runx2+Osx- pre-OBs. Dashed arrows indicate proliferative Edu +Runx2+Osx + immature OBs. Arrowheads indicate amputation plane. Scale bar represents 100 µm and 20 µm in magnified panels. (J) Total number of Runx2 +Osx + and Runx2 +Osx- proliferative OBs subtypes at 48 hpa fins, treated with PBS or 2DG (PBS = 28, 2DG = 27 cryosections). (K) Percentage of proliferative Runx2 +Osx + and Runx2 +Osx OBs subtypes in 48 hpa caudal fins , treated with PBS or 2DG. E: epidermis; B: bone; M: mesenchyme. For all graphs, statistical analysis corresponds to Mann-Whitney and Mean ± SD are displayed. ns: not significant; **p<0.0001. See Figure 6—source data 1. |
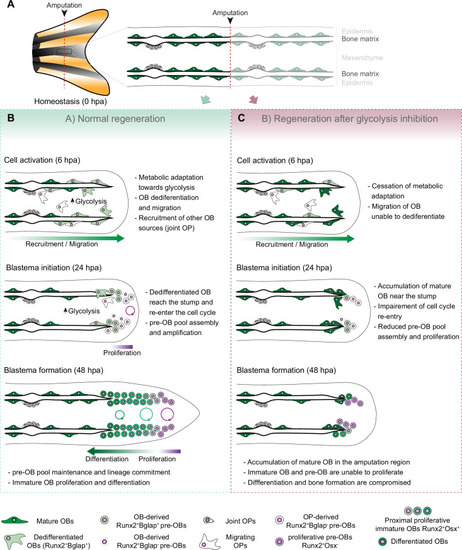
(A) In homeostasis, mature OBs reside in close contact with the bony-ray surface, secreting the collagenous bone matrix. (B) Upon caudal fin amputation, OBs and other cell types in the regenerating fin respond by undergoing a metabolic adaptation that stimulates glycolysis and is essential for regeneration to proceed. Enhancing glycolytic influx promotes OB dedifferentiation, by releasing Cyp26b1 from NF-ΚB repression, and cell cycle re-entry, by interfering with the master regulation of caudal fin proliferation Fgf20a, thereby enabling OBs to act as progenitor cells. Moreover, glycolysis is necessary to maintain the correct proliferative ability and distribution of OBs populations within the blastema, during its formation. (C) Glycolysis inhibition has a severe impact on OB dedifferentiation and pre-OBs pool assembly, which supports new OB formation and proliferation, ultimately leading to impaired bony-ray regeneration and suppression of blastema formation. |