
|
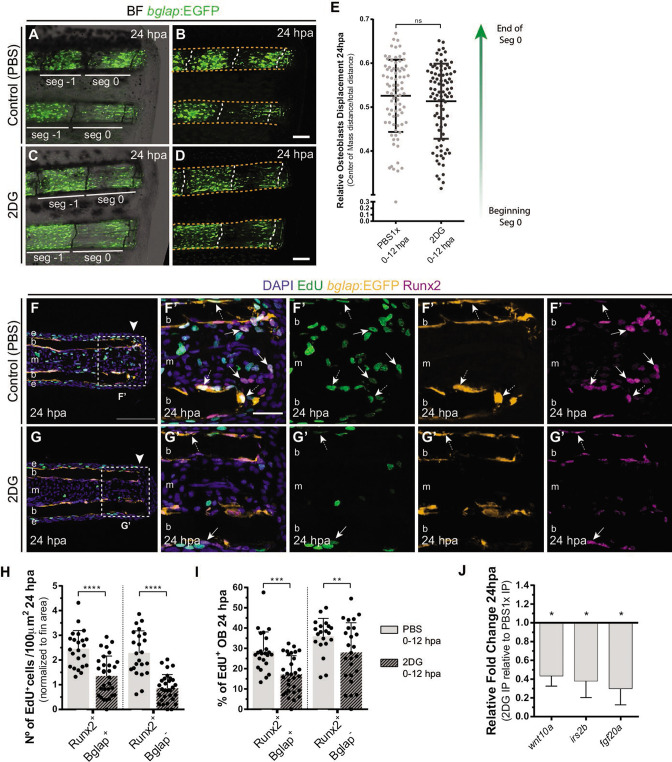
Fig. 5
(A–D) Representative images of bglap:EGFP caudal fins at 24 hpa, treated with (A–B) vehicle (PBS) or (C–D) 2DG. Double white arrows indicate the anterior (A) and posterior (P) axis. White dashed lines indicate intersegment regions. Orange dashes lines delineate the bony-ray surface. (E) Measurement of relative OB displacement along segment 0, below the amputation plane, at 24 hpa in fins treated with vehicle (PBS) or 2DG. Statistical analysis on graph corresponds to Mann-Whitney test with Mean ± SD (PBS = 90, 2DG = 82 bony-rays). (F-G’) Representative cryosection images of 24 hpa bglap:EGFP (orange) caudal fins immunostained for Runx2 (magenta), labeled with EdU (green) and counterstained with DAPI (blue), in fish treated with (F) control (PBS) or (G) 2DG. Dashed boxes delineate amplified panels in F’ and G’. Arrows indicate proliferative EdU +Runx2+Bglap cells. Dashed arrows indicate proliferative EdU +Runx2+Bglap + cells. Arrowhead indicates amputation plane. Scale bar represents 100 µm and 30 µm in amplified panels. (H) Total number of Runx2 +Bglap + and Runx2 +Bglap cells at 24hpa, in fins treated with vehicle (PBS) or 2DG. (I) Percentage of proliferative Runx2 +Bglap + and Runx2 +Bglap cells at 24hpa, in fins treated with vehicle (PBS) or 2DG. Statistical analysis displayed on each graph corresponds to Mann-Whitney test with Mean ± SD (n=23–30 cryosections). (J) Relative gene expression at 24 hpa in 2DG treated fins, compared to control. Statistical analysis with unpaired t test and Welch’s correction (n=5 biological replicates). ns: not significant; *p<0.0001. See Figure 5—source data 1.