
|
Fig. 4
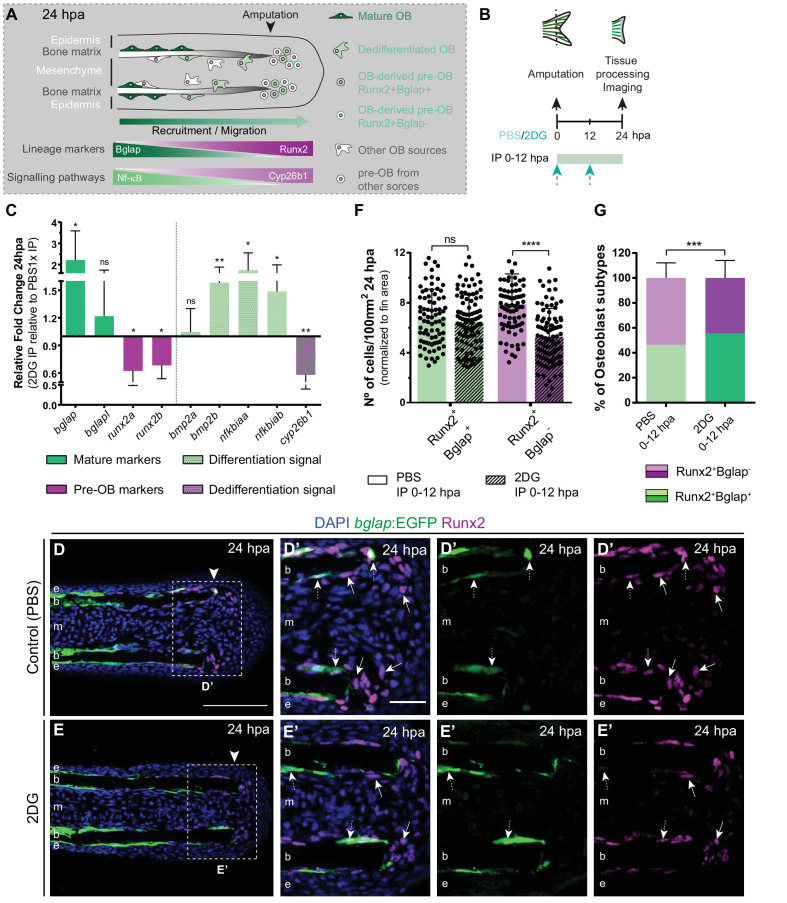
(A) Schematic representation of pre-OBs formation during regeneration. Pre-OBs arise from OB dedifferentiation and potentially from the joint OP niche. OB dedifferentiation is correlated with inactivation of NF-ΚB and increase in Cyp26b1 activity. (B) Experimental design used to inhibit glycolysis. Fish are administered, via IP injection, with vehicle (PBS) or 2DG, from fin amputation (0 hpa) until 24 hpa. (C) Relative gene expression of mature and pre-OBs markers, and differentiation and dedifferentiation pathways, in the whole fin stump at 24 hpa, in 2DG treated fins compared to control condition (0 hpa). Statistical analysis with paired t-test (n=10 biological replicates). (D-E’) Representative cryosection images of 24 hpa bglap:EGFP (green) caudal fins immunostained for Runx2 (magenta) and counterstained with DAPI (blue), in fish treated with (D,D’) vehicle (PBS) or (E,E’) 2DG. White dashed boxes delineate magnified panels in D’ and E’. Arrows indicate Runx2 +Bglap cells. Dashed arrows indicate Runx2 +Bglap + cells. Arrowhead indicates amputation plane. E: epidermis; b: bone; m: mesenchyme. Scale bar represents 100 µm and 30 µm in magnified panels. (F) Total number of Runx2 +Bglap + and Runx2 +Bglap cells per area at 24 hpa. (G) Percentage of Runx2 +Bglap + and Runx2 +Bglap OBs subtypes. Statistical analysis displayed on each graph corresponds to Mann-Whitney test with Mean ± SD (n=79 (PBS) and 89 (2DG) cryosections). ns: not significant; ** p<0.01; *** p<0.0001. See Figure 4—source data 1.