
Fig. 1
- ID
- ZDB-FIG-220824-37
- Publication
- Brandão et al., 2022 - A regeneration-triggered metabolic adaptation is necessary for cell identity transitions and cell cycle re-entry to support blastema formation and bone regeneration
- Other Figures
- All Figure Page
- Back to All Figure Page
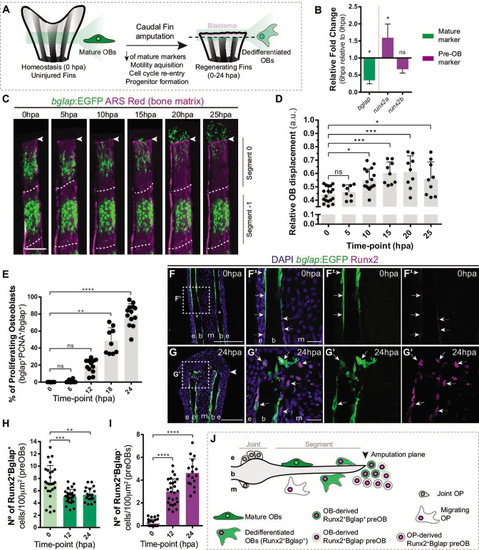
Osteoblast dedifferentiation time-window during caudal fin regeneration. (A) Biological traits of OB dedifferentiation process. (B) Relative gene expression of mature (green) and pre-OB (magenta) markers, at 6 hpa relative to 0 hpa. Statistical analysis on graph corresponds to paired t-test with Welch’s correction. Mean ± SD are displayed (n=4 biological replicates). (C) Live imaging analysis of OB motility in bglap:EGFP fish (green) during the first 25 hpa, highlighted in the segment bellow amputation (segment 0) and segment –1. Bony-rays are labeled with Alizarin red (magenta). White dashed lines delineate the intersegment region. (D) Quantification of the relative OB displacement in segment 0. Statistical analysis displayed on graph corresponds to Kruskal-Wallis test with Mean ± SD (n=9–18 bony-rays). (E) Percentage of proliferating OBs through immunofluorescence against PCNA in bglap:EGFP fish. Statistical analysis displayed on graph corresponds to Kruskal-Wallis test with Mean ± SD (n=9–13 cryosections). (F-G’) Representative cryosection images of bglap:EGFP (green) fins immunostained for Runx2 (magenta) and counterstained with DAPI (blue), in (F, F’) uninjured fish and (G, G’) at 24 hpa; arrows indicate Runx2 +Bglap + cells and dashed arrows indicate Runx2 +Bglap cells. (H, I) Quantification of (H) Runx2 +Bglap + and (I) Runx2 +Bglap cells during the first 24hpa. Statistical analysis displayed on graph corresponds to Mann-Whitney test with Mean ± SD (n=18–27 cryosections). (J) Cellular sources that contribute for new pre-OBs formation after injury include mature osteoblasts and potentially joint OP. White arrowhead indicates amputation plane and dashed squares represent magnified panels in F’ and G’. E: epidermis; b: bone; m: mesenchyme; ns: not significative; *p<0,05; **p<0,01; ***p<0,001; ****p<0,0001. Scale bars represent 100 µm and 30 µm in magnified panels. See Figure 1—source data 1.
|