
- Title
-
TGS1 impacts snRNA 3'-end processing, ameliorates survival motor neuron-dependent neurological phenotypes in vivo and prevents neurodegeneration
- Authors
- Chen, L., Roake, C.M., Maccallini, P., Bavasso, F., Dehghannasiri, R., Santonicola, P., Mendoza-Ferreira, N., Scatolini, L., Rizzuti, L., Esposito, A., Gallotta, I., Francia, S., Cacchione, S., Galati, A., Palumbo, V., Kobin, M.A., Tartaglia, G.G., Colantoni, A., Proietti, G., Wu, Y., Hammerschmidt, M., De Pittà, C., Sales, G., Salzman, J., Pellizzoni, L., Wirth, B., Schiavi, E.D., Gatti, M., Artandi, S.E., Raffa, G.D.
- Source
- Full text @ Nucleic Acids Res.
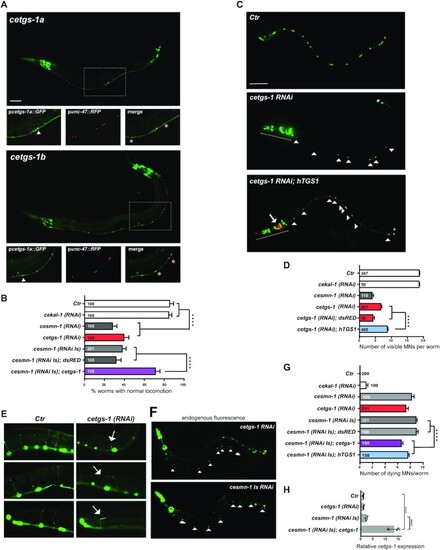
Knockdown of cetgs-1 or cesmn-1 in D-type MNs results in similar phenotypes that are rescued by cetgs-1 and hTGS1 overexpression. (A) The promoters of the pcetgs-1a and pcetgs-1b isoforms drive the expression of GFP in MNs of the ventral cord. D-type (GABA) MNs express RFP under the control of the MN-specific promoter (punc-47). In merged images, the D-type MNs expressing both cetgs-1 (GFP)and punc-47(RFP) are marked by asterisks. The cells expressing only cetgs-1(GFP) are MNs other than D-type (arrowheads). Anterior is left and ventral is down in all images. Scale bar, 50 μm. (B) Knockdown of cetgs-1 or cesmn-1 in D-type MNs leads to similar locomotion defects. Wild-type (Ctr) and cekal-1-silenced animals are controls. The locomotion defect elicited by cesmn-1 silencing is rescued by cetgs-1 (driven by the pan-neuronal punc-119 promoter) but not by dsRED expression. Bars represent the percentage of animals with normal backward locomotion ± SEM, from at least two independent lines/clones. Numbers within bars are the animals tested. ****P < 0.0001 (one-way ANOVA). No statistically significant differences were observed between cesmn-1(RNAi) and cetgs-1(RNAi) (P = 0.41) or cesmn-1(RNAi) and cesmn-1(RNAi Is) (P = 0.50). (C) Transgenic worms expressing GFP [oxIs12 (punc-47::GFP)] show 19 D-type MNs of the ventral cord (Ctr). cetgs-1(RNAi) worms display fewer GFP-expressing MNs in the ventral cord compared with controls. This phenotype is partially rescued by hTGS1 expression. MNs are indicated by arrowheads; the RNAi construct is not expressed in the tail, where one GFP-positive cell is always detectable (asterisk); the heads (underlined) express the pchs-2::GFP injection marker in both cetgs-1(RNAi) and cetgs-1(RNAi); hTGS1 worms; the latter were also injected with the podr-1::RFP marker (arrow). Scale bar, 75 μm. (D) Quantification of ventral cord D-type MNs. Neuron loss caused by cetgs-1 knockdown is partially rescued by pan-neuronal expression of human TGS1 (hTGS1) but not of dsRED. Each bar represents the mean number of visible MNs from at least two independent lines/clones ± SEM. Numbers within the bars are the animals tested. ****P < 0.0001 (one-way ANOVA). (E) In oxIs12 [punc-47::GFP] transgenic animals, both MN cell bodies and axons are visible. In control (Ctr) and cekal-1(RNAi) animals, commissures appear as single, straight axons directed to the upper side. cetgs-1 knockdown worms exhibit commissures with extra branching and guidance defects (arrows). (F) Apoptotic autofluorescence signals (arrowheads) in dying MNs of cetgs-1(RNAi) and cesmn-1(RNAi Is) animals. (G) Quantification of dying MNs. Bars represent the average number of dying MNs in transgenic animals from at least two independent lines/clones ± SEM. Numbers within and next to bars are the animals tested. ****P < 0.0001 (one-way ANOVA). No statistically significant differences were observed by comparing: cesmn-1 (RNAi) and cetgs-1(RNAi) (P = 0.27) or cesmn-1(RNAi) and cesmn-1(RNAi Is) (P = 0.08). (H) RT-qPCR showing the overexpression of cetgs-1 in cesmn-1(RNA Is); cetgs-1 animals, driven by the pan-neuronal punc-119 promoter (>10-fold higher than in the wild type). The reduction in cetgs-1 expression could not be detected in cetgs-1(RNAi) animals, as silencing occurs in 19 neurons that represent just 0.6% of total cells. Data are from three biological replicates, are normalized to ceact-1 and are relative to wild-type animals (Ctr). ****P < 0.0001 (one-way ANOVA). |
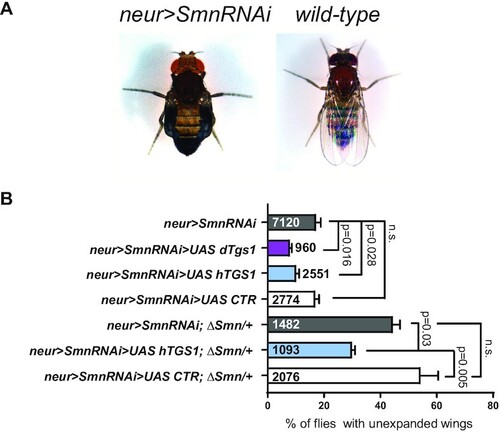
Tgs1 overexpression ameliorates the wing expansion defects caused by neuronal knockdown of Smn in Drosophila. (A) Examples of flies showing wing expansion failure upon nsyb-GAL4-driven (neur>) Smn RNAi. (B) Frequencies of the defective wing expansion phenotype in flies co-expressing a UAS-Smn RNAi (Smn RNAi) construct and the indicated UAS constructs driven by nsyb-GAL4 (neur>). UAS dTgs1 encodes GFP-tagged dTgs1; UAS hTGS1 encodes GFP-tagged human TGS1; UAS CTR is a control construct expressing the unrelated Mst protein. ΔSmn/+ flies are heterozygous for a deficiency of the Smn locus. Error bars: ± SEM. Numbers within and next to bars are the animals tested. P-values: one-way ANOVA with Tukey's multiple comparisons test. |
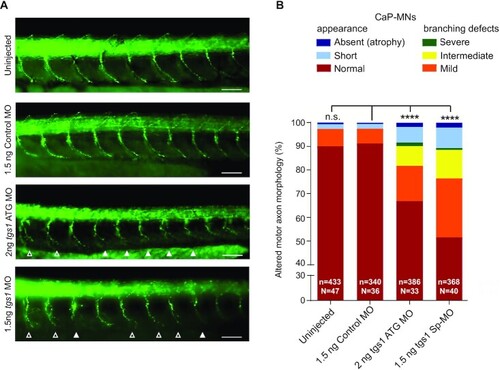
Tgs1 down-regulation in zebrafish leads to defects in CaP-MNs. (A) Lateral views of whole-mount embryos immunostained with a synaptotagmin antibody (Znp1) that labels the CaP-MNs. Embryos were untreated or injected with the indicated MOs. Injection of either tgs1 ATG-MO or tgs1 Sp-MO results in truncated or absent motor axons (solid arrowheads) and terminally branched axons (open arrowheads). Scale bar, 25 μm. See also Supplementary Figure S2. (B) Based on overall appearance, CaP-MNs were classified as: normal, short (truncated axonal projection) or absent (axonal atrophy). Based on terminal branching, axons were classified as normal, mild (branching ventral from midline), intermediate (2–3 or more branches at ventral or midline) or severe (>3 branches ventral or dorsal from the midline). Zebrafish larvae injected with 1.5 ng of tgs1 Sp-MO or 2 ng tgs1 ATG-MO displayed CaP-MN defects compared with control (non-targeting) MOs and uninjected fish. Results are percentages from three independent experiments (n = axons analysed; N = animals tested. ****P < 0.0001 χ2 test); n.s. not significant. See also Supplementary Figure S2D. |

TGS1 deficiency affects maturation of U2 snRNAs in human cells. (A) Western blotting (WB) showing TGS1 expression in two independent CRISPR clones of HeLa cells (M1, M2). CTR is the parental cell line; TGS1 M1R and CTR R are a TGS1 M1 and a parental line stably expressing FLAG-TGS1. Tubulin is a loading control. The abundance of the SMN protein is not affected by mutations in TGS1 (see also Supplementary Figures S3C, D and S6B). (B) RT-qPCR showing the abundances of the indicated snRNAs in TGS1 M1, TGS1 M2 (collectively indicated as TGS1 M) and TGS1 M1R cells. Data from three independent experiments are relative to parental HeLa cells (set to 1) and normalized to 5.8S rRNA. The U3 snoRNA (U3) and the uncapped U6 and U6atac snRNAs are controls. No statistically significant differences were observed between TGS1 M and TGS1 M1R cells (error bars: ± SEM; P-values: all > 0.05; two-way ANOVA with Sidak's multiple comparisons test). (C) Total RNA from control (CTR), TGS1 M1 and TGS1 M1R cells was precipitated with the R1131 anti-TMG CAP antibody (50,76,77) (TMG IP) or control IgGs (IgG IP). Histogram bars represent the fold enrichment of the indicated transcripts in RIP eluates (relative to input), determined by RT-qPCR and normalized to TMG IP from control cells (expressed as the percentage of input). IgG IP bar: values of IgG IPs for the three cell types were pooled into a single bar. MMG-capped GAPDH mRNA and the uncapped 5.8S rRNA are negative controls. Data are from 3–5 independent experiments. P-value: two-way ANOVA with Sidak's multiple comparisons test. See also Supplementary Figure S4A and B. (D) RIP was performed with the R1131 anti-TMG antibody (TMG) or control IgG on nuclear extracts from control (CTR), TGS1 M1 and TGS1 M1R cells. Membranes were probed for U3 snoRNA, U2 and U1 snRNAs; the 5S rRNA, which lacks a TMG cap, is a negative control. Histogram bars represent the quantification of the U2, U1 and U3 RNAs, by densitometric analysis. Data are from three biological replicates. Note the presence of U2 snRNA precursors (arrow) in nuclear extracts from TGS1 M1 cells, which display reduced hypermethylation of U2 snRNA and U3 snoRNA, but not of U1 snRNA. (E) Representative northern blots showing U2 snRNA precursors (arrow) in nuclear and cytoplasmic fractions. RNA was purified from nuclear and cytoplasmic extracts from: TCAB1 K1 HeLa mutant cells [this cell line, described in (48) has reduced CBs and was used as a control]; CTR, parental HeLa cells; TGS1 M1 and TGS1 M1R cells. Membranes were probed for the U1, U2, U4atac, U5 snRNA and the U3 snoRNA. 5S rRNA and tRNA-Arg were used as loading controls. EtBr rRNA staining is a loading control. Western blots with Coilin, CBP20, alpha-tubulin and GAPDH were used as loading controls. |
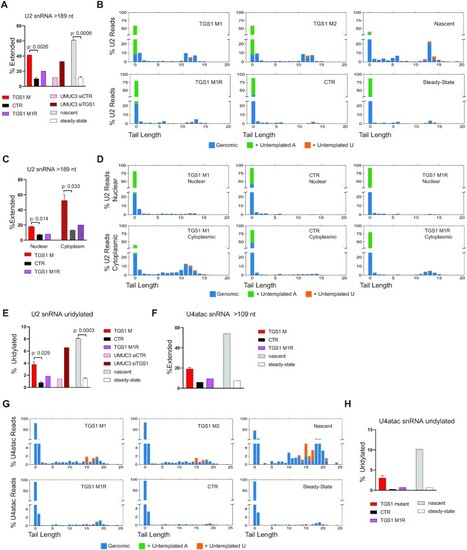
TGS1 loss leads to an accumulation of 3′-extended U2 and U4atac snRNAs in human cells. (A) 3′ RACE and sequencing on total RNA showing that TGS1 mutant HeLa cells accumulate more U2-extended snRNA molecules than either parental (CTR) or TGS1 M1R cells. UMUC3 cells treated with TGS1 siRNAs (siTGS1) also accumulate more U2-extended snRNAs than cells exposed to non-targeting siRNAs (siSCR). Nascent and steady-state RNA fractions were purified from control HeLa cells (see the Materials and Methods). Extended U2 molecules carry extra 3′ sequences of templated and/or untemplated nucleotides. Average reads per sample > 78 000 ± 41 000. Data are mean values of two independent clones + SEM. P-values: two-sided Student's t-test. (B) Plots showing the percentage of the different sequence reads of U2 snRNAs in the same HeLa cell samples as in (A). Numbers on the x-axis: additional nucleotides beyond the 189 nt of the mature form. Position 0 includes mature U2 snRNA species of 188 nt or 188 nt plus a post-transcriptionally added A. y-axis: percentage of total reads. Blue, genomic-templated nucleotides; green, untemplated adenosine; orange, untemplated uridine. (C) Characterization of U2 snRNA molecules from nuclear and cytoplasmic fractions from TGS1 M1, TGS1 M2, TGS1 M1R and control (CTR) cells. (D) Tail length and composition of U2 snRNAs in the samples shown in (C). y-axis: percentage of total reads. (E) Percentages of U2 molecules with tails ending with post-transcriptionally added uridines in the HeLa cell RNA samples described in (A). Total reads per sample > 75 000. (F) Percentages of 3′-extended U4atac snRNAs in the RNA samples described in (A). Average reads per sample > 106 000 ± 21 000 (Nascent: >11 000). (G) Tail lengths and composition of the 3′ ends of U4atac snRNAs in TGS1 M1, TGS1 M2, TGS1 M1R and control (CTR) cells. Numbers on the x-axis: additional nucleotides beyond the 130 nt of mature U4atac (position 0). y-axis: percentage of total reads. (H) Percentages of U4atac snRNA molecules with extended tails ending with untemplated uridines. Total reads per sample > 75 000. |
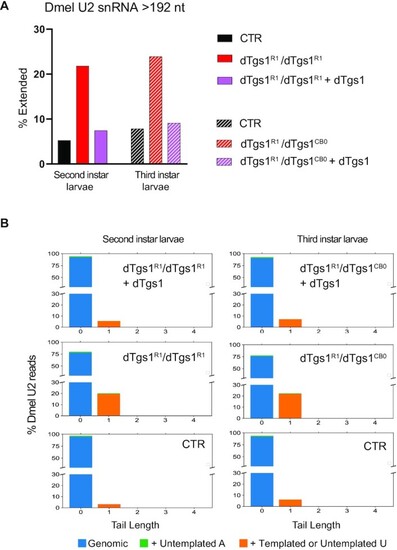
3′-Extended U2 snRNA molecules accumulate in Drosophila dTgs1 mutants. (A) Percentage of extended U2 snRNA molecules determined by 3′ RACE and sequencing on RNA from equally aged second or third instar mutant larvae, rescued mutant larvae (bearing a dTgs1 construct) and wild-type larvae (CTR). The most abundant population of U2 snRNAs is 192 nt long. Extended U2 snRNAs are longer than 192 nt and incorporate templated or untemplated nucleotides at their 3′ ends. Total reads > 2900. (B) Tail length and composition of the 3′ ends of U2 snRNAs for the second and third instar larvae described in (A). Numbers on the x-axis: additional nucleotides beyond the mature form of 192 nt (position 0). y-axis: percentage of total reads. |
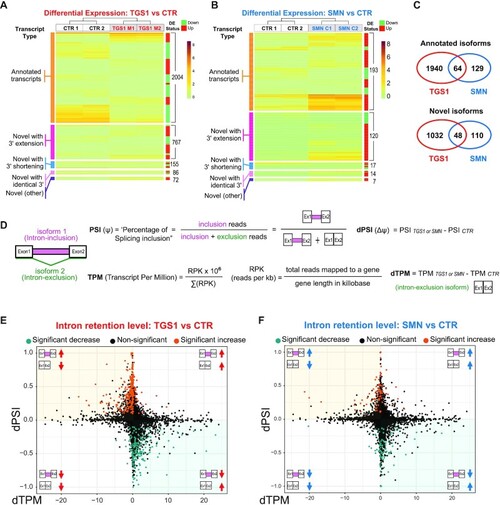
Mutations in TGS1 and SMN cause global changes in RNA expression and splicing. (A, B) Heatmaps depicting the expression levels (TPM values estimated by Kallisto) for differentially expressed (DE) transcripts in TGS1 M1 and TGS1 M2 (A), or SMN C1 and SMN C2 (B) mutant cells, compared with parental HeLa cells (CTR). Transcripts are classified into five types: annotated transcripts per GENCODE (orange); novel transcripts with extended 3′ (magenta) or shortened 3′ (blue); novel transcripts with annotated identical 3′ (pink); and other (intergenic and opposite-strand) novel transcripts (purple). Transcripts within each group are ranked by unsupervised clustering. Total transcript number for each group and the DE status for each transcript (either up- or down-regulated in mutant cells) are annotated by the green/red sidebar to the right (see also Supplementary Table S1). (C) Venn diagram from data in (A) and (B), showing the significant number of shared DE transcript isoforms (both annotated and unannotated) between TGS1 and SMN mutant cells. See also Supplementary Table S1. (D) Methodological approach used for quantification of intron retention (IR) levels (see also the Materials and Methods). (E, F) Scatter plots showing for each IR event between mutant (TGS1 M1 and M2 or SMN C1 and C2) and CTR cells the differential PSI (dPSI) against the differential expression level (dTPM) of the major transcript (intron exclusion). The significant IR events are color-coded in the plots, with significantly up-regulated events colored in orange and significantly down-regulated in teal. |
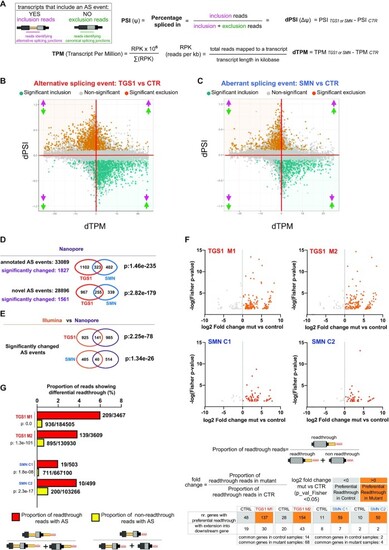
Analysis of the aberrant transcripts that accumulate in TGS1 and SMN mutant cells by Oxford Nanopore sequencing. (A) Methodological approach used for transcript quantification and evaluation of transcript differential splicing. (B,C) Scatter plots showing, for each AS event between mutant (TGS1 M1, M2 and SMN C1, C2) and parental HeLa cells (CTR), the differential PSI (dPSI) against the differential expression level (dTPM) of the major transcript (that does not contain the AS event). The significant differential splicing events are color-coded in the plots, with significantly included events colored in orange and significantly excluded events in teal. Non-significant events are in gray (see also Supplementary Figure S10A for a classification of the AS events and Supplementary Table S6). The arrows indicate up- or down-regulation of AS inclusion transcripts (pink) and AS exclusion transcripts (green), as depicted in (A), respectively. (D) Venn diagrams showing the number of annotated and novel differential splicing events found in TGS1 M1, M2 and SMN C1, C2 mutant cells by Nanopore sequencing. The statistical significance of the intersection was determined via Fisher's exact test. See also Supplementary Table S7. (E) Venn diagram showing the number of the differential splicing events identified by Illumina and Nanopore analysis in TGS1 and SMN mutant cells. The statistical significance of the intersection was determined via Fisher's exact test. See also Supplementary Table S8. (F) Dot plots showing differential readthrough events in mutant cells (orange dots) versus control cells (gray dots). For each readthrough event, the value of the log2(fold change) (mutant versus control) is reported on the x-axis. Statistical significance of the fold enrichment for each event was determined by Fisher's exact test (P-values on the y-axis; P < 0.05 was considered significant). The numbers of genes with ‘Preferential Readthrough in Mutant’ (orange) or ‘Preferential Readthrough in CTR’ (gray) are reported below the graphs. See also Supplementary Table S9; and the Materials and Methods. (G) Bar plot showing that, in mutant samples, the percentage of reads that carry an aberrant splicing event is higher among readthrough reads compared with non-readthrough reads. Only reads mapping to the last exons undergoing ‘Preferential Readthrough in Mutant’ events were used for this analysis. Aberrant splicing was assessed by comparing reads from mutant samples against non-readthrough reads from control samples. The significance of the difference in the proportions of aberrant splicing reads between readthrough and non-readthrough reads was assessed using the χ2 test. See also Supplementary Table S10. |
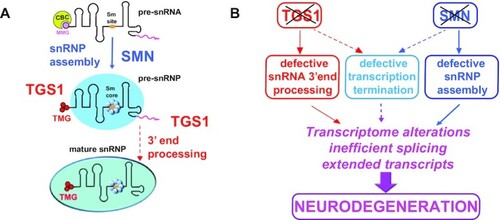
SMN and TGS1 protect against neurodegeneration through both common and specific routes. (A) Roles of SMN and TGS1 in snRNA biogenesis. The dashed arrow line indicates that the role of TGS1 in 3′-end processing could be indirect. (B) A model for the roles of TGS1 and SMN in prevention of neurodegeneration. The effects of TGS1 or SMN deficiency on snRNA biogenesis and general transcription suggest that these proteins play interconnected roles in prevention of neurodegeneration. |