
|
Fig. 1
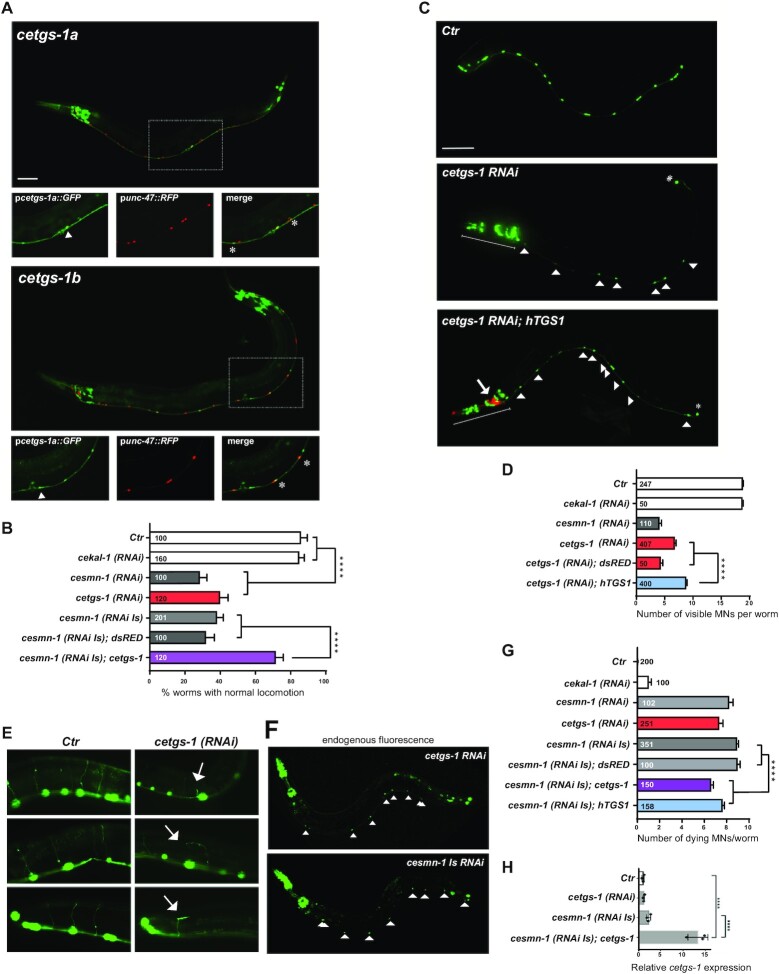
Knockdown of cetgs-1 or cesmn-1 in D-type MNs results in similar phenotypes that are rescued by cetgs-1 and hTGS1 overexpression. (A) The promoters of the pcetgs-1a and pcetgs-1b isoforms drive the expression of GFP in MNs of the ventral cord. D-type (GABA) MNs express RFP under the control of the MN-specific promoter (punc-47). In merged images, the D-type MNs expressing both cetgs-1 (GFP)and punc-47(RFP) are marked by asterisks. The cells expressing only cetgs-1(GFP) are MNs other than D-type (arrowheads). Anterior is left and ventral is down in all images. Scale bar, 50 μm. (B) Knockdown of cetgs-1 or cesmn-1 in D-type MNs leads to similar locomotion defects. Wild-type (Ctr) and cekal-1-silenced animals are controls. The locomotion defect elicited by cesmn-1 silencing is rescued by cetgs-1 (driven by the pan-neuronal punc-119 promoter) but not by dsRED expression. Bars represent the percentage of animals with normal backward locomotion ± SEM, from at least two independent lines/clones. Numbers within bars are the animals tested. ****P < 0.0001 (one-way ANOVA). No statistically significant differences were observed between cesmn-1(RNAi) and cetgs-1(RNAi) (P = 0.41) or cesmn-1(RNAi) and cesmn-1(RNAi Is) (P = 0.50). (C) Transgenic worms expressing GFP [oxIs12 (punc-47::GFP)] show 19 D-type MNs of the ventral cord (Ctr). cetgs-1(RNAi) worms display fewer GFP-expressing MNs in the ventral cord compared with controls. This phenotype is partially rescued by hTGS1 expression. MNs are indicated by arrowheads; the RNAi construct is not expressed in the tail, where one GFP-positive cell is always detectable (asterisk); the heads (underlined) express the pchs-2::GFP injection marker in both cetgs-1(RNAi) and cetgs-1(RNAi); hTGS1 worms; the latter were also injected with the podr-1::RFP marker (arrow). Scale bar, 75 μm. (D) Quantification of ventral cord D-type MNs. Neuron loss caused by cetgs-1 knockdown is partially rescued by pan-neuronal expression of human TGS1 (hTGS1) but not of dsRED. Each bar represents the mean number of visible MNs from at least two independent lines/clones ± SEM. Numbers within the bars are the animals tested. ****P < 0.0001 (one-way ANOVA). (E) In oxIs12 [punc-47::GFP] transgenic animals, both MN cell bodies and axons are visible. In control (Ctr) and cekal-1(RNAi) animals, commissures appear as single, straight axons directed to the upper side. cetgs-1 knockdown worms exhibit commissures with extra branching and guidance defects (arrows). (F) Apoptotic autofluorescence signals (arrowheads) in dying MNs of cetgs-1(RNAi) and cesmn-1(RNAi Is) animals. (G) Quantification of dying MNs. Bars represent the average number of dying MNs in transgenic animals from at least two independent lines/clones ± SEM. Numbers within and next to bars are the animals tested. ****P < 0.0001 (one-way ANOVA). No statistically significant differences were observed by comparing: cesmn-1 (RNAi) and cetgs-1(RNAi) (P = 0.27) or cesmn-1(RNAi) and cesmn-1(RNAi Is) (P = 0.08). (H) RT-qPCR showing the overexpression of cetgs-1 in cesmn-1(RNA Is); cetgs-1 animals, driven by the pan-neuronal punc-119 promoter (>10-fold higher than in the wild type). The reduction in cetgs-1 expression could not be detected in cetgs-1(RNAi) animals, as silencing occurs in 19 neurons that represent just 0.6% of total cells. Data are from three biological replicates, are normalized to ceact-1 and are relative to wild-type animals (Ctr). ****P < 0.0001 (one-way ANOVA).