
|
Fig. 8
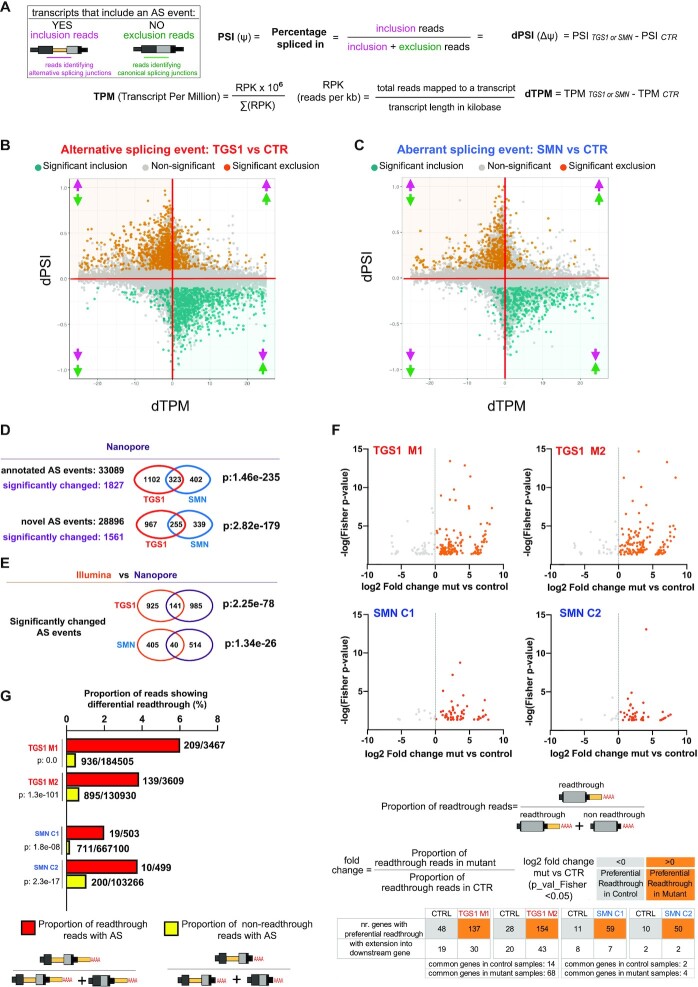
Analysis of the aberrant transcripts that accumulate in TGS1 and SMN mutant cells by Oxford Nanopore sequencing. (A) Methodological approach used for transcript quantification and evaluation of transcript differential splicing. (B,C) Scatter plots showing, for each AS event between mutant (TGS1 M1, M2 and SMN C1, C2) and parental HeLa cells (CTR), the differential PSI (dPSI) against the differential expression level (dTPM) of the major transcript (that does not contain the AS event). The significant differential splicing events are color-coded in the plots, with significantly included events colored in orange and significantly excluded events in teal. Non-significant events are in gray (see also Supplementary Figure S10A for a classification of the AS events and Supplementary Table S6). The arrows indicate up- or down-regulation of AS inclusion transcripts (pink) and AS exclusion transcripts (green), as depicted in (A), respectively. (D) Venn diagrams showing the number of annotated and novel differential splicing events found in TGS1 M1, M2 and SMN C1, C2 mutant cells by Nanopore sequencing. The statistical significance of the intersection was determined via Fisher's exact test. See also Supplementary Table S7. (E) Venn diagram showing the number of the differential splicing events identified by Illumina and Nanopore analysis in TGS1 and SMN mutant cells. The statistical significance of the intersection was determined via Fisher's exact test. See also Supplementary Table S8. (F) Dot plots showing differential readthrough events in mutant cells (orange dots) versus control cells (gray dots). For each readthrough event, the value of the log2(fold change) (mutant versus control) is reported on the x-axis. Statistical significance of the fold enrichment for each event was determined by Fisher's exact test (P-values on the y-axis; P < 0.05 was considered significant). The numbers of genes with ‘Preferential Readthrough in Mutant’ (orange) or ‘Preferential Readthrough in CTR’ (gray) are reported below the graphs. See also Supplementary Table S9; and the Materials and Methods. (G) Bar plot showing that, in mutant samples, the percentage of reads that carry an aberrant splicing event is higher among readthrough reads compared with non-readthrough reads. Only reads mapping to the last exons undergoing ‘Preferential Readthrough in Mutant’ events were used for this analysis. Aberrant splicing was assessed by comparing reads from mutant samples against non-readthrough reads from control samples. The significance of the difference in the proportions of aberrant splicing reads between readthrough and non-readthrough reads was assessed using the χ2 test. See also Supplementary Table S10.