
Fig. 7
- ID
- ZDB-FIG-230516-26
- Publication
- Chen et al., 2022 - TGS1 impacts snRNA 3'-end processing, ameliorates survival motor neuron-dependent neurological phenotypes in vivo and prevents neurodegeneration
- Other Figures
- All Figure Page
- Back to All Figure Page
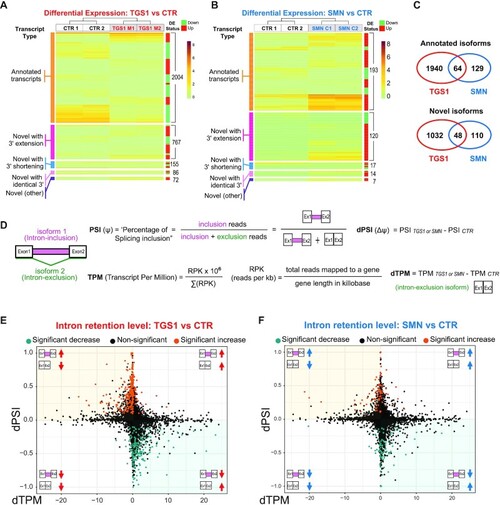
Mutations in TGS1 and SMN cause global changes in RNA expression and splicing. (A, B) Heatmaps depicting the expression levels (TPM values estimated by Kallisto) for differentially expressed (DE) transcripts in TGS1 M1 and TGS1 M2 (A), or SMN C1 and SMN C2 (B) mutant cells, compared with parental HeLa cells (CTR). Transcripts are classified into five types: annotated transcripts per GENCODE (orange); novel transcripts with extended 3′ (magenta) or shortened 3′ (blue); novel transcripts with annotated identical 3′ (pink); and other (intergenic and opposite-strand) novel transcripts (purple). Transcripts within each group are ranked by unsupervised clustering. Total transcript number for each group and the DE status for each transcript (either up- or down-regulated in mutant cells) are annotated by the green/red sidebar to the right (see also Supplementary Table S1). (C) Venn diagram from data in (A) and (B), showing the significant number of shared DE transcript isoforms (both annotated and unannotated) between TGS1 and SMN mutant cells. See also Supplementary Table S1. (D) Methodological approach used for quantification of intron retention (IR) levels (see also the Materials and Methods). (E, F) Scatter plots showing for each IR event between mutant (TGS1 M1 and M2 or SMN C1 and C2) and CTR cells the differential PSI (dPSI) against the differential expression level (dTPM) of the major transcript (intron exclusion). The significant IR events are color-coded in the plots, with significantly up-regulated events colored in orange and significantly down-regulated in teal. |