FIGURE SUMMARY
Title

Phytochemical and Safety Evaluations of Finger Lime, Mountain Pepper, and Tamarind in Zebrafish Embryos

Authors
Cáceres-Vélez, P.R., Ali, A., Fournier-Level, A., Dunshea, F.R., Jusuf, P.R.
Source
Full text @ Antioxidants (Basel)

Heatmap of the concentration of bioactive compounds (μg/g) in finger lime (FL), mountain pepper (MP), and tamarind (T).

Heatmap of the alterations observed in zebrafish embryos exposed during 96 h to the plant extracts. The mean of three replicates (n = 20/replicate) is reported for finger lime (A), mountain pepper (B), and tamarind (C).

Phenotypic assessment of zebrafish development for the whole organism exposed 96 h post-fertilization to different concentrations of finger lime (A,D), mountain pepper (B,E), and tamarind (C,F). Cumulative mortality observed at 96 h of exposure are shown in panel (A) for finger lime, (B) for mountain pepper, and (C) for tamarind. The mortality frequency observed at different experimental times of exposure is shown for finger lime (D), mountain pepper (E), and tamarind (F). The colours in (DF) represent the age at which mortality was observed (in hours post-fertilization). Data show the mean ± SD, n = 60. Asterisks indicate statistical significance when compared to control groups: p < 0.001 (***).

Morbidity assessments of zebrafish development for the whole organism exposed at 96 h post-fertilization to different concentrations of finger lime (A), mountain pepper (B), and tamarind (C). In (C), bradycardia is represented for groups exposed to tamarind. Non-Cir. Tail = non-circulation (of blood) in the tail; Balance A = balance alteration. Colours in (A,B) represent the concentrations tested (mg/L). Data represent the mean ± SD, n = 60. Asterisks indicate statistical significance when comparing the exposed groups with the control groups: p < 0.05 (*) and p < 0.001 (***).

Developmental alterations observed in organisms exposed at 96 h post-fertilization to different concentrations of finger lime (A), mountain pepper (B), and tamarind (C) extracts. The alterations observed were hatching delay (Hatching D), pigmentation delay (Pig. D), developmental delay (Dev. D), yolk sac absorption delay (Yolk Sac AD), yolk sac edema (Yolk Sac E), and cardiac edema (Cardiac E). Bar colours represent the concentration tested in mg/L. Data represent the mean ± SD, n = 60. Asterisks indicate statistical significance when comparing the exposed groups with the control groups: p < 0.05 (*), p < 0.01(**) and p < 0.001 (***).

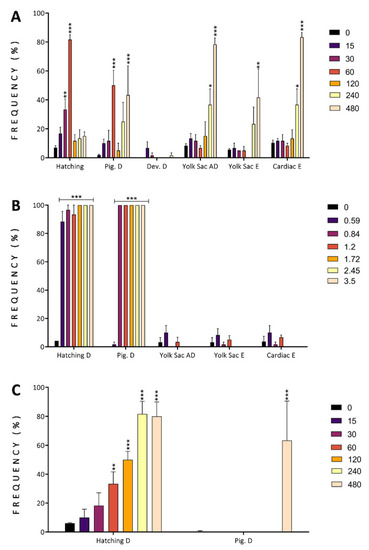
Malformations observed in zebrafish exposed at 96 h post-fertilization to different concentrations of finger lime and mountain pepper extracts. Each colour bar denotes the concentration tested in mg/L for finger lime (A) and mountain pepper (B). Malformations were mainly observed in the head, eyes, spine and tail. No statistically significant difference was observed when comparing the exposed and control groups for both finger lime and mountain pepper, and no malformations were observed for tamarind. Data represent the mean ± SD, n = 60.

Acknowledgments
This image is the copyrighted work of the attributed author or publisher, and ZFIN has permission only to display this image to its users. Additional permissions should be obtained from the applicable author or publisher of the image. Full text @ Antioxidants (Basel)