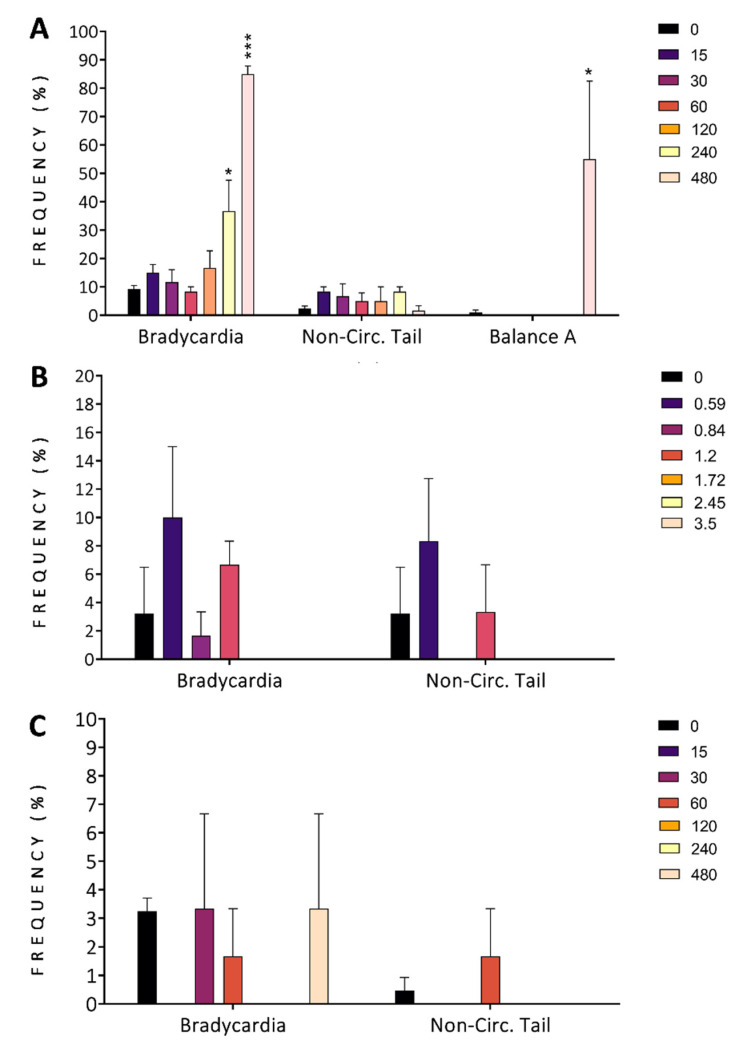
IMAGE

Figure 4

ID
ZDB-IMAGE-220801-33
Source
Figures for Cáceres-Vélez et al., 2022
Image
Figure Caption

Figure 4

Morbidity assessments of zebrafish development for the whole organism exposed at 96 h post-fertilization to different concentrations of finger lime (A), mountain pepper (B), and tamarind (C). In (C), bradycardia is represented for groups exposed to tamarind. Non-Cir. Tail = non-circulation (of blood) in the tail; Balance A = balance alteration. Colours in (A,B) represent the concentrations tested (mg/L). Data represent the mean ± SD, n = 60. Asterisks indicate statistical significance when comparing the exposed groups with the control groups: p < 0.05 (*) and p < 0.001 (***).

Acknowledgments
This image is the copyrighted work of the attributed author or publisher, and ZFIN has permission only to display this image to its users. Additional permissions should be obtained from the applicable author or publisher of the image. Full text @ Antioxidants (Basel)