IMAGE

Figure 3

ID
ZDB-IMAGE-220801-32
Source
Figures for Cáceres-Vélez et al., 2022
Image
Figure Caption

Figure 3

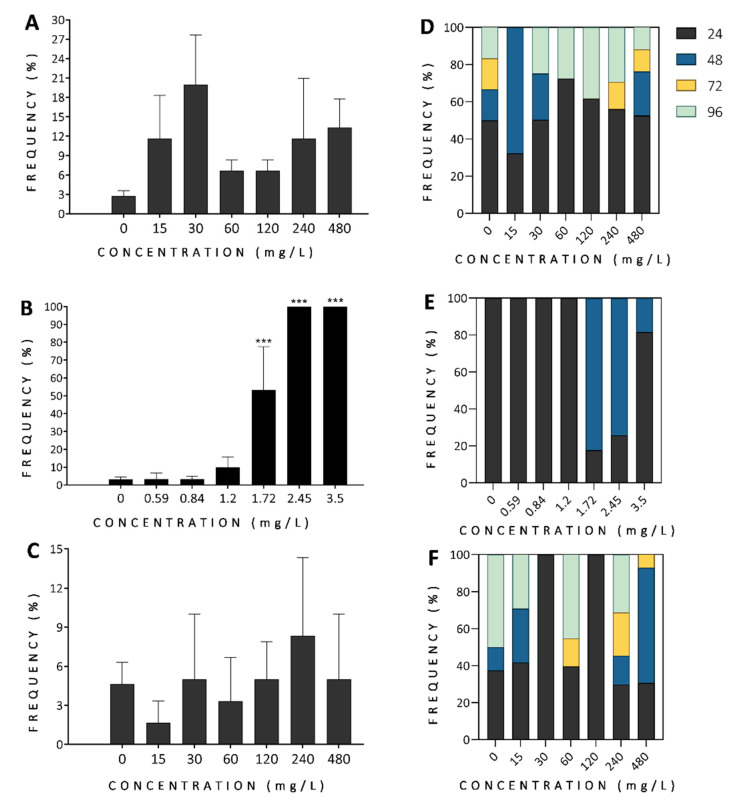
Phenotypic assessment of zebrafish development for the whole organism exposed 96 h post-fertilization to different concentrations of finger lime (A,D), mountain pepper (B,E), and tamarind (C,F). Cumulative mortality observed at 96 h of exposure are shown in panel (A) for finger lime, (B) for mountain pepper, and (C) for tamarind. The mortality frequency observed at different experimental times of exposure is shown for finger lime (D), mountain pepper (E), and tamarind (F). The colours in (DF) represent the age at which mortality was observed (in hours post-fertilization). Data show the mean ± SD, n = 60. Asterisks indicate statistical significance when compared to control groups: p < 0.001 (***).

Acknowledgments
This image is the copyrighted work of the attributed author or publisher, and ZFIN has permission only to display this image to its users. Additional permissions should be obtained from the applicable author or publisher of the image. Full text @ Antioxidants (Basel)