
- Title
-
Impairing proliferation of glioblastoma multiforme with CD44+ selective conjugated polymer nanoparticles
- Authors
- Lubanska, D., Alrashed, S., Mason, G.T., Nadeem, F., Awada, A., DiPasquale, M., Sorge, A., Malik, A., Kojic, M., Soliman, M.A.R., deCarvalho, A.C., Shamisa, A., Kulkarni, S., Marquardt, D., Porter, L.A., Rondeau-Gagné, S.
- Source
- Full text @ Sci. Rep.
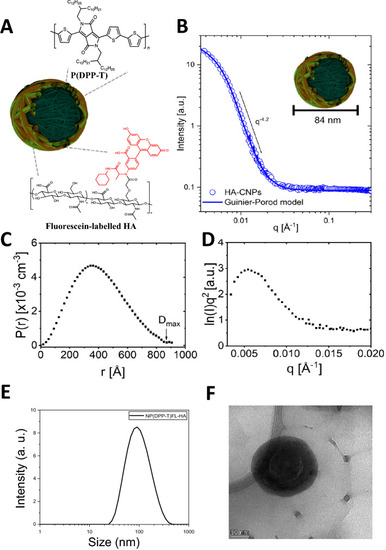
Design and Structural Characterization of the HA-CPNs. (A) Schematic structure of HA-CPNs; (B) SANS form factor for a dilute dispersion of HA-CNPs in D2O fit with a solid line using an empirical Guinier-Porod model. The slope in the Porod region of the plot shows a q-dependency of q−4.2, suggesting a spherical particle shape; (C) Real-space distance distribution function from an inversion approach demonstrating uniformity consistent with spherical particles of maximum dimension Dmax; (D) Kratky plot demonstrates a peak and plateau characteristic of compact globular structures. (E) Dynamic light scattering of HA-CPNs. Average diameter of 109 nm; (F) Transmission electron microscopy image of HA-CPNs. Scale bar of 50 nm. |
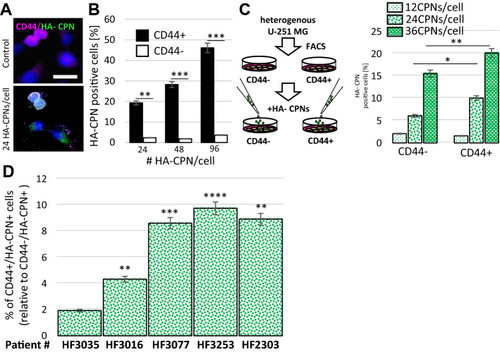
HA-CPNs Demonstrate Selective Uptake by CD44 Enriched U-251 MG Cells as well as GBM Patient-derived Cells. (A) Representative image of cells stained with anti-CD44 antibody and treated with 24 HA-CPNs/cell or vehicle control (Control); scale bar: 25 μm; (B) Flowcytometry analysis of U-251 MG cells stained with anti-CD44 antibody and treated with 24, 48, 96 HA-CPNs/cell or vehicle control (Control). Cells positive for HA-CPNs graphed as % of cells positive (CD44 +) and/or negative (CD44-) for the antibody stain; (C) Flowcytometry analysis of HA- CPN positive U-251 MG cells in FACS- derived CD44 + and CD44- populations treated with 12, 24, 36 HA-CPNs/cell graphed as % of the population tested; (D) GBM patient- derived cultures (HF3035, HF3016, HF3077, HF3253, HF2303) tested for CD44-selective HA-CPN uptake and quantified as % of CD44 + cells relative to the % uptake in CD44- cells. Data shown as mean ± s.d, n = 3, *p < 0.05, **p < 0.01, ***p < 0.001; Student’s t-test. |
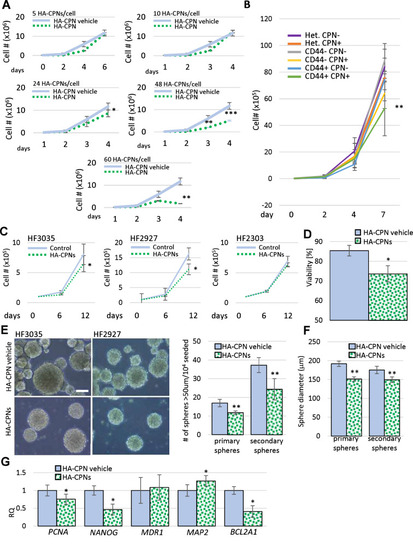
Effects of HA-CPNs on Proliferation and Stemness of Primary GBM Patient- derived cell lines. (A) U-251 MG cells treated with indicated concentrations of HA-CPNs or vehicle control (HA-CPN vehicle) and subjected to trypan blue exclusion assay over a time course of 6 days; (B) Proliferation of heterogeneous (Het.), CD44 + and CD44- populations of U-251 MG cells, FACS- enriched for HA-CPNs (HA-CPN +) compared to HA-CPN- cells, assessed using trypan blue exclusion assay; (C–G) Patient lines, HF3035, HF2927 and HF2303, treated with 24 HA-CPNs/ cell and/or HA-CPN vehicle control and subjected to: a viability assay- average number of viable cells assessed over three cell lines tested, quantified as % of total population via trypan blue exclusion assay (C), a proliferation assay over the time course of 12 days- cell number assessed via trypan blue exclusion assay at the indicated time points (D), neurosphere formation assay, representative images of HF3035 and HF2927 (left); scale bar = 100 μm. Number of spheres formed is quantified per every 104 cells seeded, three lines averaged (E), assessment of an average diameter of spheres formed; three lines pooled for analysis (F), qRT-PCR analysis of mRNA levels of the indicated markers of stemness/differentiation (G). Data shown as mean ± s.d, n = 3, *p < 0.05, **p < 0.01; Student’s t-test. |
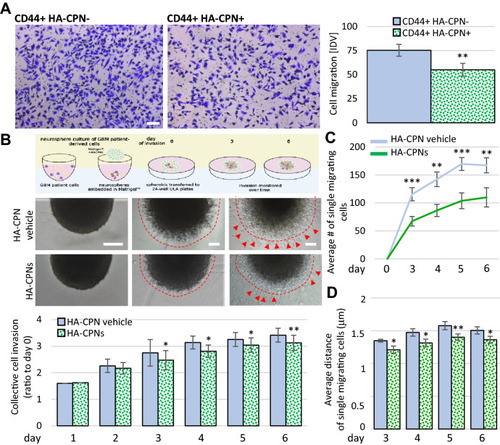
Treatment with HA-CPNs Regulates Migration and Invasion in Glioma. (A) Boyden chamber assay using CD44 + U-251 MG cells treated and FACS- enriched for HA-CPNs (CD44 + HA-CPN +) compared to HA-CPN- cells (CD44 + HA-CPN-). Representative images (left). Scale bar = 100 μm. Migrated cells scored in five fields of view per replicate over three replicates, using ImageJ as Integrated Density Value (IDV) (right); (B, C) Matrigel™ invasion assay using GBM patient derived spheres treated with HA-CPNs and/or HA-CPN vehicle control over a time course of six days. Schema of the protocol (top), representative images (mid panel). Scale bars = 100 μm; (B) Schema representing sphere invasion assay in MatrigelTM; Created with BioRender.com (top) and collective invasion measured using ImageJ as change in sphere radius over time. Quantified values averaged over 6 spheres per treatment, per time point, over 3 patient cell lines (bottom). Leading edge assessed optically, marked by dashed line; (C) Average number of single cells migrating (red arrowheads in B) scored using ImageJ per each Matrigel™- embedded sphere at the indicated timepoints; (D) Average distance of the single cell migration at the indicated timepoints. Data shown as mean ± s.d, n = 3, *p < 0.05, **p < 0.01, ***p < 0.001; Student’s t-test. |
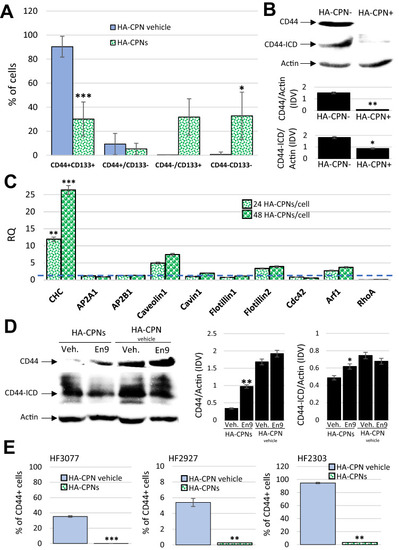
HA-CPNs Downregulate the Expression Levels and Signaling Activity of CD44 in GBM. (A) U-251 MG cells were treated with HA-CPNs and/or vehicle control (HA-CPN vehicle) and subjected to flowcytometry analysis of the indicated TIC populations; (B) Assessment of the protein expression levels of CD44 and CD44 intracytoplasmic domain (CD44-ICD) via Western blotting in FACS derived HA-CPN + and HA-CPN- cells (top). Protein levels quantified using densitometry and shown as ratio to Actin in Integrated Density Values (IDV) (bottom, graphs); (C) mRNA expression of signature markers of diverse endocytotic mechanisms in U-251 MG cells treated with 24 and/or 48 HA-CPNs/cell relative to HA-CPN vehicle control (dotted line); (D) CD44 and CD44-ICD protein expression levels in U-251 MG cells treated with HA-CPNs and/or HA-CPN vehicle control in the presence of Endosidin 9 or vehicle control (left). Protein levels quantified using densitometry and shown as ratio to Actin in Integrated Density Values (IDV) (right); (E) Flowcytometry analysis of CD44 expression levels in the indicated GBM patient samples treated with HA-CPNs and/or HA-CPN vehicle control. Data shown as mean ± s.d, n = 3, *p < 0.05, **p < 0.01, ***p < 0.001; Student’s t-test. Original blotted membranes of Western can be found in Fig. S7. |
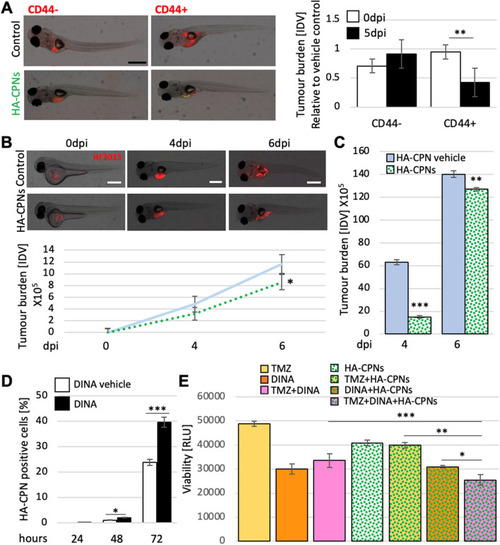
Decrease of Tumour Burden in GBM Zebrafish PDXs and Enhanced Treatment Sensitivity upon Exposure to HA-CPNs. (A) Representative image (left) and tumour foci burden analysis (right) in zebrafish embryos injected with fluorescently labelled (red) CD44 + and/or CD44- cells and analysed at 0- and 5-days post injection. Tumour burden quantified and graphed as Integrated Density Values (IDV) for HA- CPN treatment/ HA-CPN vehicle control treatment (Control) at the indicated time points; (B) HF3035 and HF2303 GBM patient-derived zebrafish PDX models treated with HA-CPNs compared to HA-CPN vehicle control; representative images of PDX using HF3035 (top) and average tumour burden quantified using ImageJ as IDV at the indicated timepoints (bottom) over two GBM patient lines; (C) Average tumour burden quantification at the indicated timepoints in PDXs derived from CD44 + HF3035 and CD44 + HF2303 GBM lines treated with HA-CPNs compared to HA-CPN vehicle control (Control) over time; (D) Cells treated with dinaciclib and/or vehicle control (Control) in the presence of 24 HA-CPNs/cell. Nanoparticle uptake analysed using flowcytometry at the indicated time points; (E) Cell viability quantified using a luminescent assay at 72 h post HA-CPN and drug treatment, as monotherapy or in combination as indicated (TMZ, Temozolomide; DINA, dinaciclib). Data shown as mean ± s.d, n = 3, *p < 0.05, **p < 0.01, ***p < 0.001; Student’s t-test. |