
|
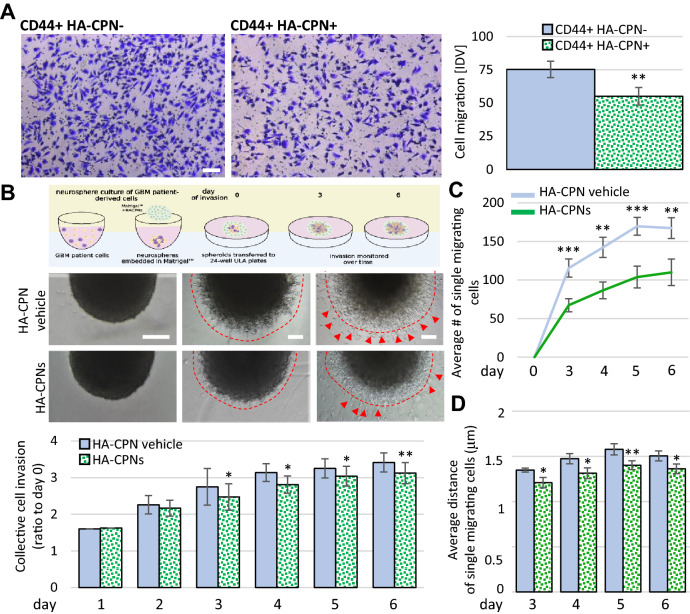
Fig. 4
Treatment with HA-CPNs Regulates Migration and Invasion in Glioma. (A) Boyden chamber assay using CD44 + U-251 MG cells treated and FACS- enriched for HA-CPNs (CD44 + HA-CPN +) compared to HA-CPN- cells (CD44 + HA-CPN-). Representative images (left). Scale bar = 100 μm. Migrated cells scored in five fields of view per replicate over three replicates, using ImageJ as Integrated Density Value (IDV) (right); (B, C) Matrigel™ invasion assay using GBM patient derived spheres treated with HA-CPNs and/or HA-CPN vehicle control over a time course of six days. Schema of the protocol (top), representative images (mid panel). Scale bars = 100 μm; (B) Schema representing sphere invasion assay in MatrigelTM; Created with BioRender.com (top) and collective invasion measured using ImageJ as change in sphere radius over time. Quantified values averaged over 6 spheres per treatment, per time point, over 3 patient cell lines (bottom). Leading edge assessed optically, marked by dashed line; (C) Average number of single cells migrating (red arrowheads in B) scored using ImageJ per each Matrigel™- embedded sphere at the indicated timepoints; (D) Average distance of the single cell migration at the indicated timepoints. Data shown as mean ± s.d, n = 3, *p < 0.05, **p < 0.01, ***p < 0.001; Student’s t-test.