
|
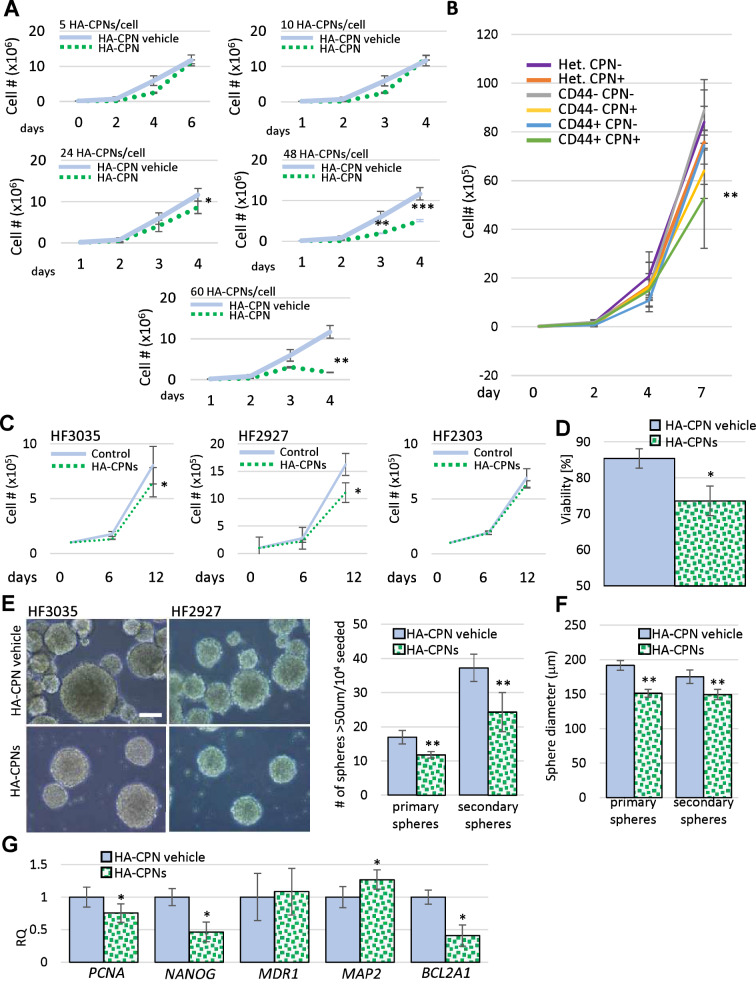
Fig. 3
Effects of HA-CPNs on Proliferation and Stemness of Primary GBM Patient- derived cell lines. (A) U-251 MG cells treated with indicated concentrations of HA-CPNs or vehicle control (HA-CPN vehicle) and subjected to trypan blue exclusion assay over a time course of 6 days; (B) Proliferation of heterogeneous (Het.), CD44 + and CD44- populations of U-251 MG cells, FACS- enriched for HA-CPNs (HA-CPN +) compared to HA-CPN- cells, assessed using trypan blue exclusion assay; (C–G) Patient lines, HF3035, HF2927 and HF2303, treated with 24 HA-CPNs/ cell and/or HA-CPN vehicle control and subjected to: a viability assay- average number of viable cells assessed over three cell lines tested, quantified as % of total population via trypan blue exclusion assay (C), a proliferation assay over the time course of 12 days- cell number assessed via trypan blue exclusion assay at the indicated time points (D), neurosphere formation assay, representative images of HF3035 and HF2927 (left); scale bar = 100 μm. Number of spheres formed is quantified per every 104 cells seeded, three lines averaged (E), assessment of an average diameter of spheres formed; three lines pooled for analysis (F), qRT-PCR analysis of mRNA levels of the indicated markers of stemness/differentiation (G). Data shown as mean ± s.d, n = 3, *p < 0.05, **p < 0.01; Student’s t-test.