
|
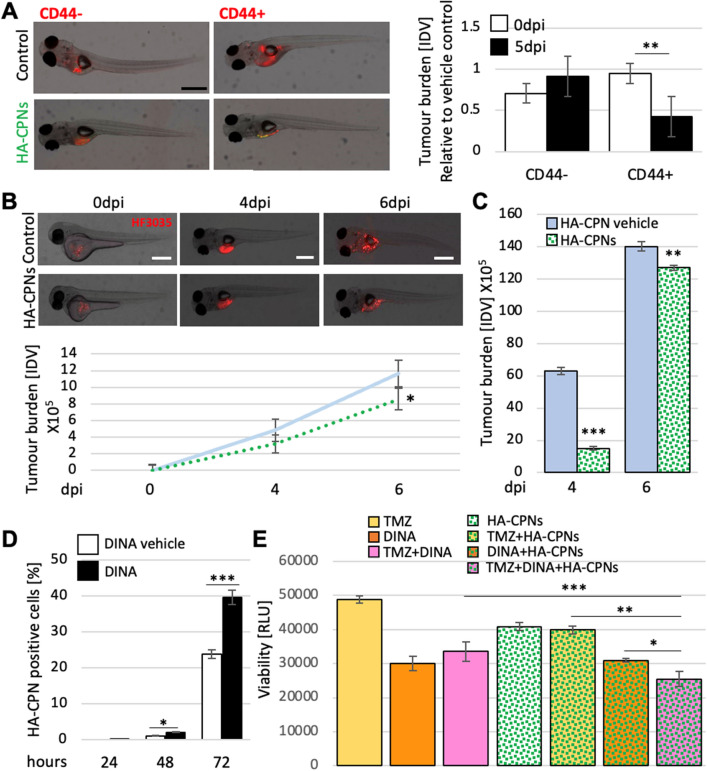
Fig. 6
Decrease of Tumour Burden in GBM Zebrafish PDXs and Enhanced Treatment Sensitivity upon Exposure to HA-CPNs. (A) Representative image (left) and tumour foci burden analysis (right) in zebrafish embryos injected with fluorescently labelled (red) CD44 + and/or CD44- cells and analysed at 0- and 5-days post injection. Tumour burden quantified and graphed as Integrated Density Values (IDV) for HA- CPN treatment/ HA-CPN vehicle control treatment (Control) at the indicated time points; (B) HF3035 and HF2303 GBM patient-derived zebrafish PDX models treated with HA-CPNs compared to HA-CPN vehicle control; representative images of PDX using HF3035 (top) and average tumour burden quantified using ImageJ as IDV at the indicated timepoints (bottom) over two GBM patient lines; (C) Average tumour burden quantification at the indicated timepoints in PDXs derived from CD44 + HF3035 and CD44 + HF2303 GBM lines treated with HA-CPNs compared to HA-CPN vehicle control (Control) over time; (D) Cells treated with dinaciclib and/or vehicle control (Control) in the presence of 24 HA-CPNs/cell. Nanoparticle uptake analysed using flowcytometry at the indicated time points; (E) Cell viability quantified using a luminescent assay at 72 h post HA-CPN and drug treatment, as monotherapy or in combination as indicated (TMZ, Temozolomide; DINA, dinaciclib). Data shown as mean ± s.d, n = 3, *p < 0.05, **p < 0.01, ***p < 0.001; Student’s t-test.