
- Title
-
Trichodermin inhibits the growth of oral cancer through apoptosis-induced mitochondrial dysfunction and HDAC-2-mediated signaling
- Authors
- Chen, H.L., Lo, Y.H., Lin, C.L., Lee, T.H., Leung, W., Wang, S.W., Lin, I.P., Lin, M.Y., Lee, C.H.
- Source
- Full text @ Biomed. Pharmacother.
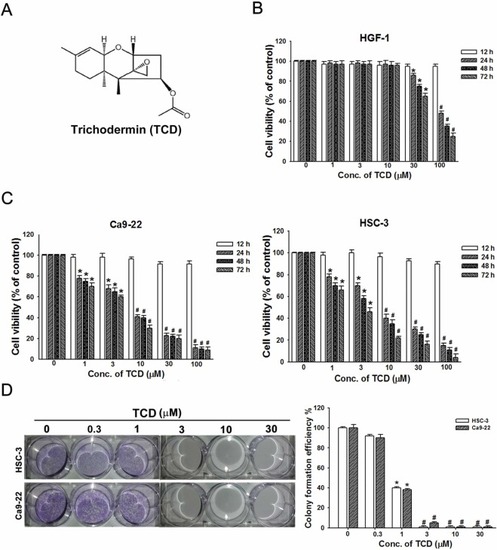
Fig. 1. Trichodermin inhibits cell viability and colony formation in human OSCC cells. (A) Structure of Trichodermin (TCD). (B and C) HGF-1 normal human gingival fibroblasts and two human OSCC cells (Ca922 and HSC-3 cells) were treated with various concentrations of TCD (0, 1, 3, 10, 30, 100 μM) for 24, 48 and 72 h. Cell viability was measured using MTT assays. (D) Colony formation assays of OSCC cells (Ca922 and HSC-3 cells) treated with or without TCD. Data represent means ± S.E.M. *P < 0.05, #P < 0.01 compared to the control group. |
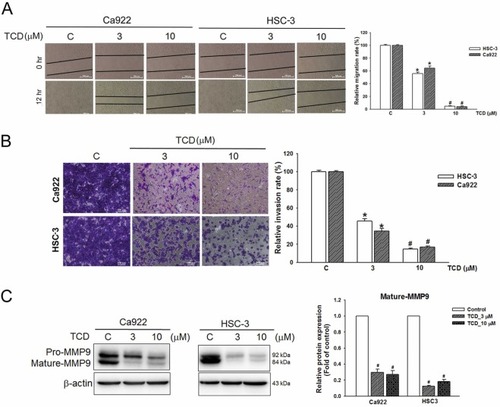
Fig. 2. Trichodermin suppresses the migration and invasion of human OSCC cells. (A) Wound healing assays reveal that migration of OSCC cells (Ca922 and HSC-3 cells) was inhibited after TCD treatment for 12 h. (B) Representative images of transwell assays suggest that the invasion was reduced expourse to TCD for 12 h in OSCC cells (Ca922 and HSC-3 cells). (C) The expression of MMP-9 was examined in OSCC cells (Ca922 and HSC-3 cells) following treatment with or without TCD treatment. Data represent means ± S.E.M. *P < 0.05, #P < 0.01 compared to the control group. |
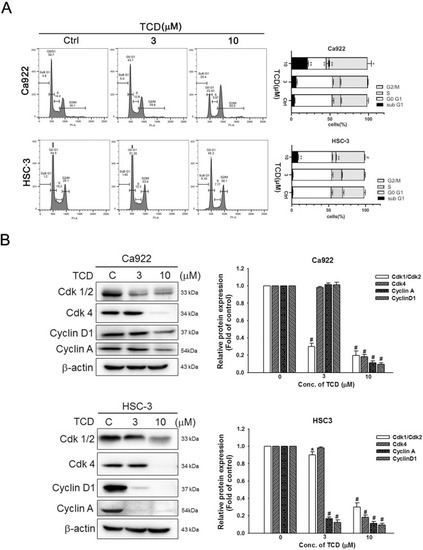
Fig. 3. Trichodermin induces G2/M cell cycle arrest in human OSCC cells. (A) OSCC cells (Ca922 and HSC-3 cells) were incubated with or without TCD. Flow cytometry showed that TCD induced G2/M cell cycle arrest and, (B) TCD reduced G2/M-related proteins assessed by Western blots. Histograms represent statistical analysis of the relative expression level of G2/M-related proteins. Data represent means ± S.E.M. *P < 0.05; #P < 0.01 compared with the control. |
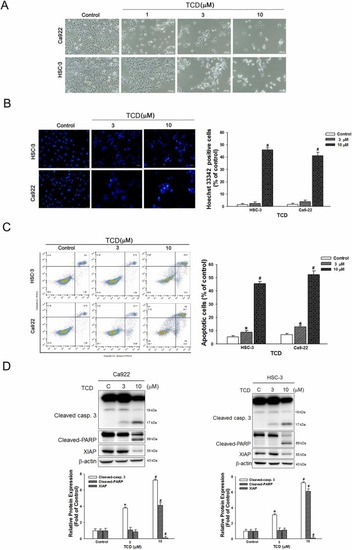
Fig. 4. Trichodermin induces caspase-mediated apoptosis in human OSCC cells. (A) OSCC cells (Ca922 and HSC-3 cells) were treated with or without TCD for 24 h, after which apoptosis was monitored by phase contrast microscopy. Magnification, 20x. (B) Hoechst 33342 staining analysis of the apoptotic cell population in OSCC cells (Ca922 and HSC-3 cells) after exposure to 0, 3 or 10 µM TCD for 24 h. (C) Analysis of apoptosis was observed in TCD-treated OSCC cells (Ca922 and HSC-3 cells) for 24 h using Annexin V-FITC/PI staining with flow cytometry. Quantification analysis of the percentage of apoptotic cells is shown. (D) Cells were treated with TCD (0, 3 or 10 μM) for 24 h, after which the expression of apoptosis-associated proteins was determined by Western blots. β-actin was used as an endogenous reference. Histograms represent statistical analysis of the relative expression level of apoptosis-associated proteins. Data represent means ± S.E.M. *P < 0.05, #P < 0.01 compared to the control group. |
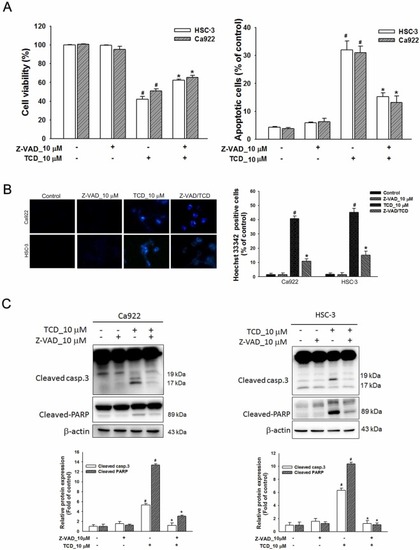
Fig. 5. Trichodermin induces apoptosis via the caspase pathways in human OSCC cells. The effect of a pan-caspase inhibitor, Z-VAD-FMK (Z-VAD), on TCD-induced apoptotic cell death. OSCC cells (Ca922 and HSC-3 cells) were pretreated with or without 10 μM Z-VAD and were subsequently exposed to 0 or 10 μM TCD. (A) Cell viability was measured using MTT assays. (B) Analysis of apoptosis was detected using Annexin V-FITC/PI staining assessed by flow cytometry. (C) Levels of cleaved caspase-3 (Cleaved casp.3) and PARP (Cleaved-PARP) proteins determined by Western blot assays. β-actin was used as an endogenous reference. Histograms represent the statistical analysis of the relative expression levels of cleaved caspase-3 and cleaved PARP proteins. Data represent means ± S.E.M. #P < 0.01 compared with the control; *P < 0.05 compared with control cells treated with TCD. |
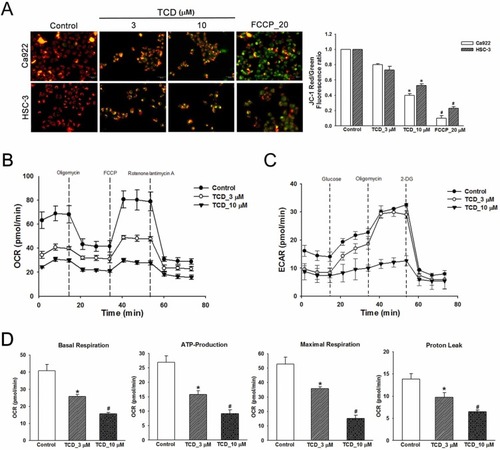
Fig. 6. Trichodermin induces mitochondrial dysfunction in human OSCC cells. (A) The mitochondrial membrane potential was measured with JC-1 and was assessed by fluorescence staining. The charts illustrate the red/green fluorescence intensity ratio and the aggregate green monomeric form. FCCP was used as a positive control. (B) OCR and (C) ECAR curve plots in oral cancer HSC-3 cells treated with 0, 3 or 10 μM TCD for 24 h; cells were examined using a Seahorse Bioscience XF24 analyzer with or without oligomycin, carbonyl cyanide-4-(trifluoromethoxy) phenylhydrazone (FCCP) and rotenone/antimycin A to measure oxygen consumption rate (OCR; pMol/min/5 ×103 cells). Quantification of the transformation in parameters induced by TCD treatment include the (D) basal respiration, ATP production, maximal respiration and proton leak. Data represent means ± S.E.M. from three independent experiments. *P < 0.05, #P < 0.01 compared with the control. |
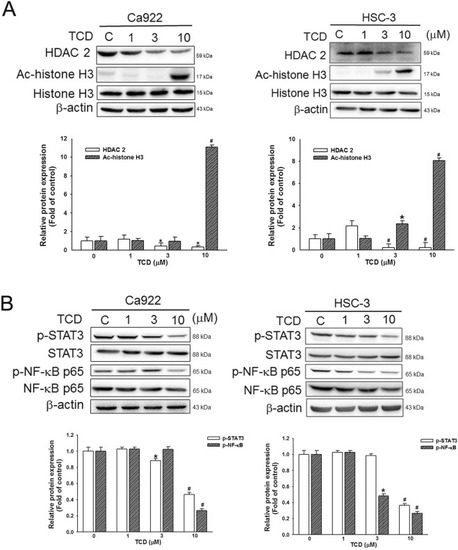
Fig. 7. Trichodermin decreases the HDCA-2-mediated signaling pathway in human OSCC cells. (A) OSCC cells (Ca922 and HSC-3 cells) were treated with the indicated concentrations of TCD, after which the expression levels of histone deacetylase 2 (HDAC-2), acetylated histone H3 (Ac-histone H3), histone H3 and β-actin were assessed by western blot analysis. (B) Levels of phospho-STAT3 (p-STAT3) and NF-κB (p- NF-κB) proteins were analyzed by Western blot assays. β-actin was used as an endogenous reference. Histograms represent the statistical analysis of the relative expression levels of phospho-STAT3 (p-STAT3) and NF-κB (p-NF-κB) proteins. Data represent means ± S.E.M. *P < 0.05, #P < 0.01 compared with the control. |
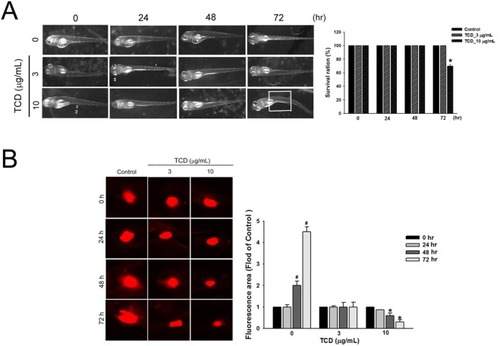
Fig. 8. Trichodermin inhibits tumor growth in a zebrafish xenograft model (A) TCD at the indicated concentrations and time had no observable toxicity effect at 72 hpi. *P < 0.05 compared with the control. (B) oral cancer HSC-3 cells labeled with a red fluorescent dye (CM‐DiI) were injected into 48 hpf normal zebrafish yolk sacs. The intensity of red fluorescence is proportional to the tumor size. Oral cancer xenograft zebrafish treated with 3 or 10 μg/mL TCD and observed at 24 and 48 hpi. Quantitative analysis of the tumor cell proliferation with or without TCD treatment. * *P < 0.01 compared with the control; *P < 0.05 compared with control cells treated with CPZ. Data represent means ± SD. hpf: hours post-fertilization; hpi: hours post-treatment or post-injection. PHENOTYPE:
|