
|
Fig. 6
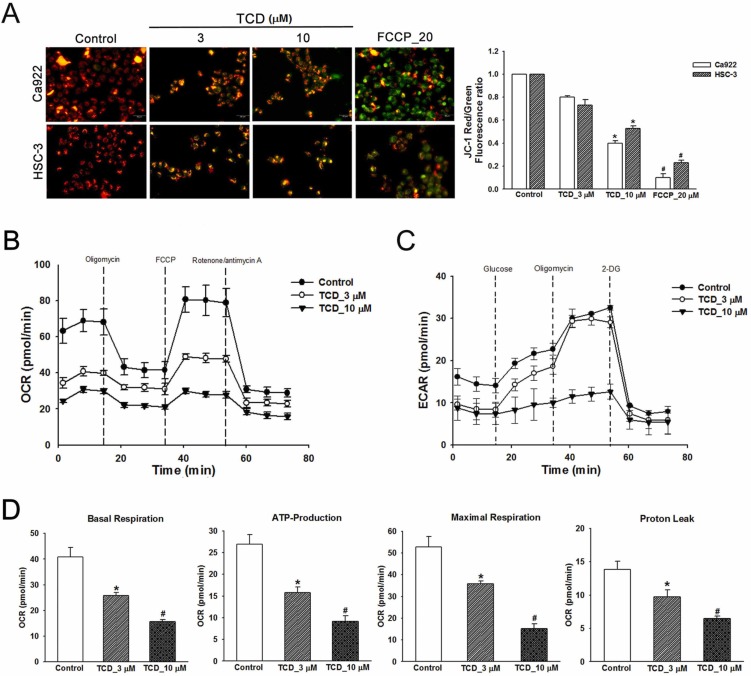
Fig. 6. Trichodermin induces mitochondrial dysfunction in human OSCC cells. (A) The mitochondrial membrane potential was measured with JC-1 and was assessed by fluorescence staining. The charts illustrate the red/green fluorescence intensity ratio and the aggregate green monomeric form. FCCP was used as a positive control. (B) OCR and (C) ECAR curve plots in oral cancer HSC-3 cells treated with 0, 3 or 10 μM TCD for 24 h; cells were examined using a Seahorse Bioscience XF24 analyzer with or without oligomycin, carbonyl cyanide-4-(trifluoromethoxy) phenylhydrazone (FCCP) and rotenone/antimycin A to measure oxygen consumption rate (OCR; pMol/min/5 ×103 cells). Quantification of the transformation in parameters induced by TCD treatment include the (D) basal respiration, ATP production, maximal respiration and proton leak. Data represent means ± S.E.M. from three independent experiments. *P < 0.05, #P < 0.01 compared with the control.