
- Title
-
Daw1 regulates the timely onset of cilia motility during development
- Authors
- Bearce, E.A., Irons, Z.H., Craig, S.B., Kuhns, C.J., Sabazali, C., Farnsworth, D.R., Miller, A.C., Grimes, D.T.
- Source
- Full text @ Development

daw1b1403 mutants exhibit motile cilia-associated defects. (A) The 418 amino acid Daw1 protein with short N-terminal domain (NTD) and large β-propeller composed of WD40 repeats. daw1b1403 deletes two conserved residues, I140 and A141. (B) Human DAW1 X-ray structure (Protein Data Bank: 5NNZ) showing I140 and A141 location. (C-E) 3D reconstitutions of µCT data. Most daw1b1403 mutants showed normal spines (D), but 20% exhibited curves (E), compared with control (C). (C′-E′) Quantitation of curvature showed curved daw1b1403 mutants had a non-stereotyped pattern (E′), compared with control (C′) and non-curved daw1b1403 mutants. (F) Top: representative image of 25 hpf larvae showing the heart (dotted oval) on top of the yolk (dotted line). Bottom: daw1b1403 mutants exhibited randomized heart laterality including left (L; green), middle (M; orange) and right (R; magenta)-facing hearts (n=91 mutants and 98 sib controls; ***P=4.84×10⁻²¹, chi square). (G) Top: otic vesicles at 25 hpf showed abnormal phenotypes in daw1b1403 mutants [2N (green) – two normal; 3F (orange) – three otoliths, posterior two fused; 3S (magenta) – three separate otoliths. Bottom: quantification of n=116 mutants and 132 sibs; ***P=1.31×10⁻¹², chi square. (H) CTD in daw1b1403 mutants was fully penetrant at 25 hpf. Scale bar: 0.5 mm (H). |
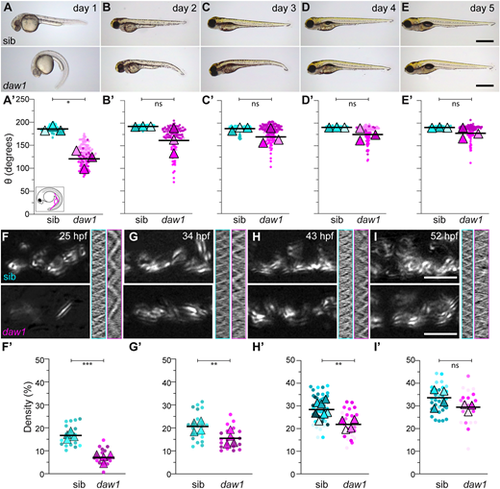
Body axis curvature self-corrects after delayed onset cilia motility. (A-E) The first 5 days of development show daw1b1403 mutants self-correct curves. (A′-E′) SuperPlots of body angle, θ (inset in A′). Pairwise comparisons used two-way ANOVA adjusted for multiple comparisons. (F-I) TICS of CC cilia motility at different time points. (F′-I′) SuperPlots of the proportion of the CC covered by cilia motility (motile area). ***P<0.001, **P<0.01, *P<0.05 (two-tailed unpaired t-tests). ns, not significant. Scale bars: 0.5 mm (A-E); 5 µm (F-I). |
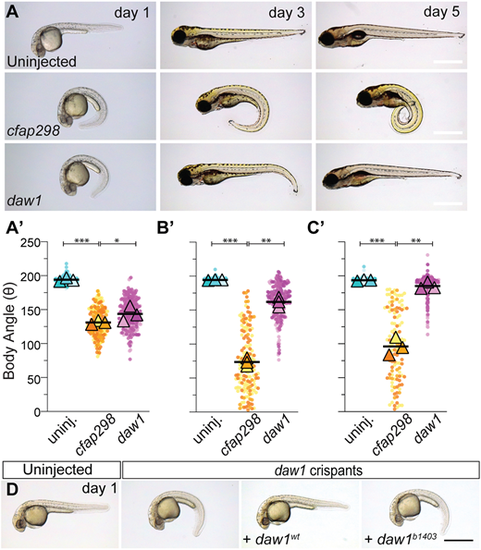
daw1b1403 encodes a loss-of-function protein. (A-C) Lateral views of controls and daw1 and cfap298 crispants. (A′-C′) SuperPlots of body angle quantitation. Pairwise comparisons used two-way ANOVA adjusted for multiple comparisons. ***P<0.001, **P<0.01, *P<0.05. ns, not significant. (D) Expression of Daw1WT but not Daw1b1403 rescues the body curves of daw1 crispants. Scale bars: 0.5 mm (A-D). |
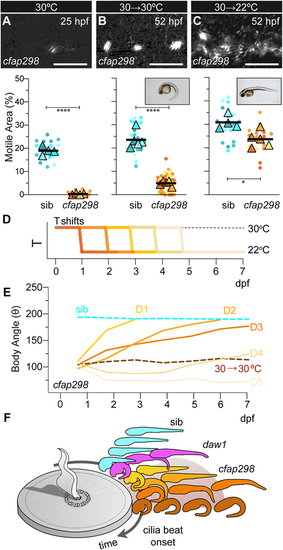
Self-correction of curves can occur throughout developmental stages. (A-C) Top: TICS of CC cilia motility of 25 hpf cfap298tm304 mutants raised at 30°C (A), then 52 hpf after maintaining 30°C (B) or downshifting to 22°C at 24 hpf (C). Bottom: SuperPlots of motility data. Insets: axis straightening occurred in downshifted embryos but not those maintained at 30°C. (D) Schematic of temperature (T) shifts. Embryos were raised at 30°C until either 1, 2, 3, 4 or 5 dpf, then downshifted to 22°C, inducing cilia motility. Body angles were assessed until 7 dpf. (E) Body angles across 1-7 dpf after temperature downshifts on days 1-5 (D1-D5). (F) Summary showing zebrafish larvae self-correct curves after robust CC cilia motility onsets. Distance around the sundial represents later times of motility onset in distinct conditions. ****P<0.0001, *P<0.05 (two-tailed unpaired t-tests). Scale bars: 5 µm (A-C). |

ZFIN is incorporating published figure images and captions as part of an ongoing project. Figures from some publications have not yet been curated, or are not available for display because of copyright restrictions. |
|
Unillustrated author statements PHENOTYPE:
|