
Image
|
Figure Caption
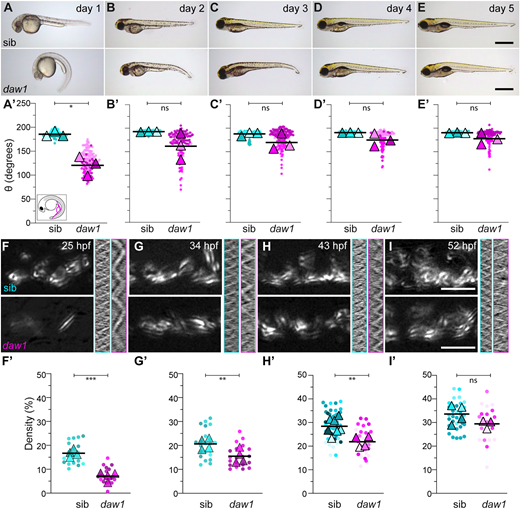
Fig. 2
Body axis curvature self-corrects after delayed onset cilia motility. (A-E) The first 5 days of development show daw1b1403 mutants self-correct curves. (A′-E′) SuperPlots of body angle, θ (inset in A′). Pairwise comparisons used two-way ANOVA adjusted for multiple comparisons. (F-I) TICS of CC cilia motility at different time points. (F′-I′) SuperPlots of the proportion of the CC covered by cilia motility (motile area). ***P<0.001, **P<0.01, *P<0.05 (two-tailed unpaired t-tests). ns, not significant. Scale bars: 0.5 mm (A-E); 5 µm (F-I).
Figure Data
Acknowledgments
This image is the copyrighted work of the attributed author or publisher, and
ZFIN has permission only to display this image to its users.
Additional permissions should be obtained from the applicable author or publisher of the image.
Full text @ Development