
|
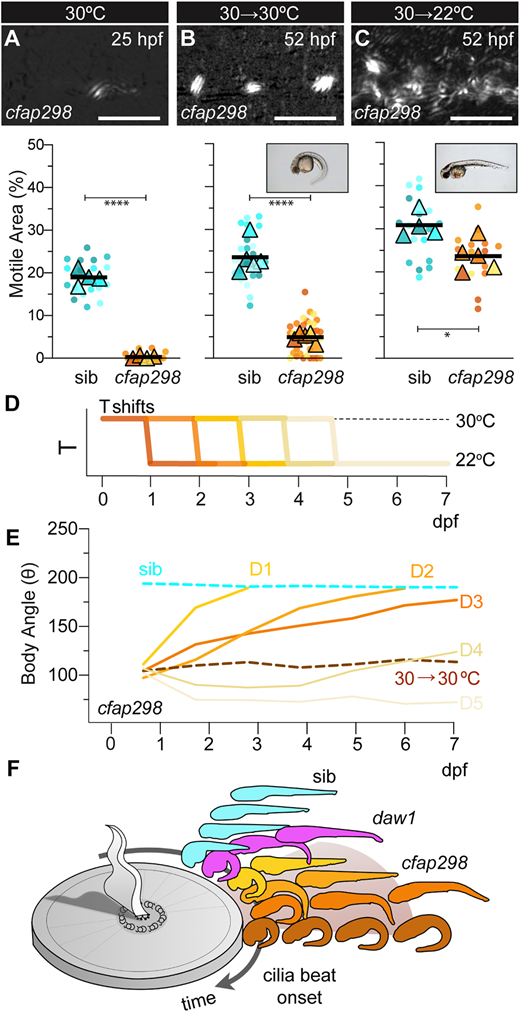
Fig. 4
Self-correction of curves can occur throughout developmental stages. (A-C) Top: TICS of CC cilia motility of 25 hpf cfap298tm304 mutants raised at 30°C (A), then 52 hpf after maintaining 30°C (B) or downshifting to 22°C at 24 hpf (C). Bottom: SuperPlots of motility data. Insets: axis straightening occurred in downshifted embryos but not those maintained at 30°C. (D) Schematic of temperature (T) shifts. Embryos were raised at 30°C until either 1, 2, 3, 4 or 5 dpf, then downshifted to 22°C, inducing cilia motility. Body angles were assessed until 7 dpf. (E) Body angles across 1-7 dpf after temperature downshifts on days 1-5 (D1-D5). (F) Summary showing zebrafish larvae self-correct curves after robust CC cilia motility onsets. Distance around the sundial represents later times of motility onset in distinct conditions. ****P<0.0001, *P<0.05 (two-tailed unpaired t-tests). Scale bars: 5 µm (A-C).