
FIGURE SUMMARY
- Title
-
Isolation and Characterization of Germline Stem Cells in Protogynous Hermaphroditic Monopterus albus
- Authors
- Sun, X., Tao, B., Wang, Y., Hu, W., Sun, Y.
- Source
- Full text @ Int. J. Mol. Sci.
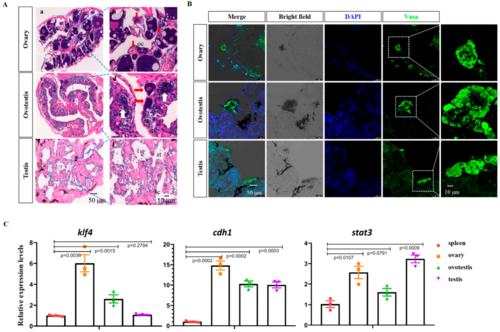
Figure 1. Identification of swamp eel germline stem cells at different stages. (A) H&E staining of ovary (a,b), ovotestis (c,d), and testis (e,f) tissues. Red arrows show the oocytes of different stages, and white arrows show the spermatocytes. oc: oocyte; sg: spermatogonia; st: round spermatids. (B) Confocal images showing the Vasa-positive cells in the adult ovary, ovotestis, and testis. (C) qRT-PCR results showing the expression of pluripotency and GSC marker genes in different types of gonads.
|
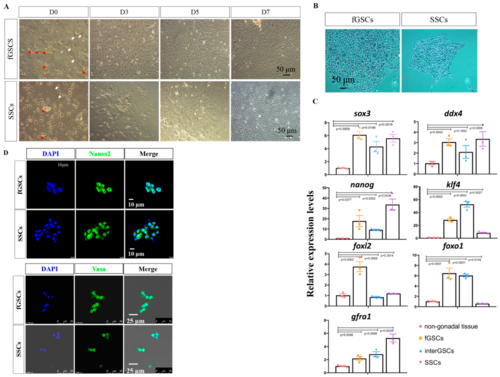
Figure 2. Isolation and characterization of GSCs derived from ovary and testis. (A) Cell morphology of GSCs isolated from ovary and testis at the indicated time points. Red arrows show the grape-like GSCs, and the white arrows show the blood cells. (B) AP staining images of fGSCs and SSCs. (C) qRT-PCR results of pluripotency- and GSC-specific genes in the isolated fGSCs, interGSCs, and SSCs. The spleen was used as the non-gonadal control. (D) Immunofluorescence staining results of Nanos2 and Vasa in fGSCs and SSCs.
|
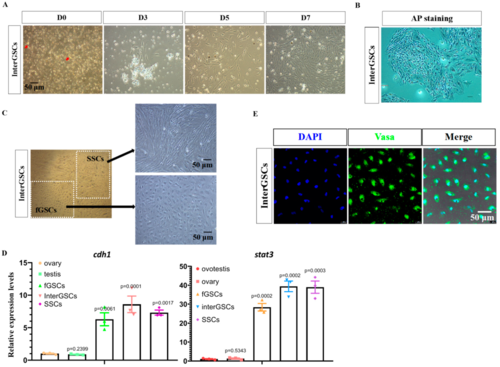
Figure 3. Isolation and characterization of interGSCs derived from ovotestis. (A) Cell morphology of GSCs isolated from ovotestis at the indicated time after isolation. Red arrows show the grape-like GSCs. (B) Image of AP staining of interGSCs isolated from ovotestis. (C) Cell morphology showing the presence of two morphologically distinct cell types. (D) qRT-PCR results of cdh1 and stat3 in fGSCs, SSCs, and interGSCs, compared with whole ovary, testis, and ovotestis tissues. (E) Immunofluorescence images for day 7 interGSCs.
|
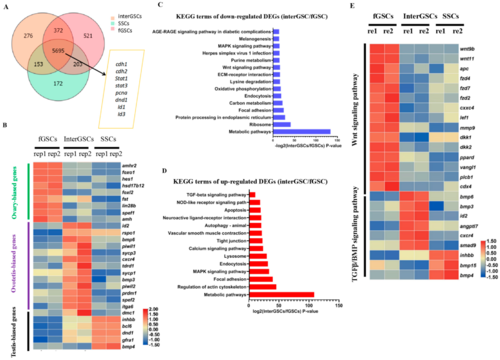
Figure 4. Transcriptome profiling of GSCs derived from ovary, ovotestis, and testis. (A) Venn diagram showing the numbers of overlapping genes among fGSCs, interGSCs, and mGSCs, FPKM > 10. (B) Heat map showing the expression of the indicated GSC-type specific genes. The color key from blue to red indicates the relative gene expression level from low to high. (C) KEGG of down-regulated DEGs in the interGSCs compared with the fGSCs. (D) KEGG of up-regulated DEGs in the interGSCs compared with the fGSCs. (E) Heat map showing the expression of Wnt- and Tgf-related genes in fGSCs, interGSCs, and SSCs. The color key from blue to red indicates the relative gene expression level, from low to high.
|
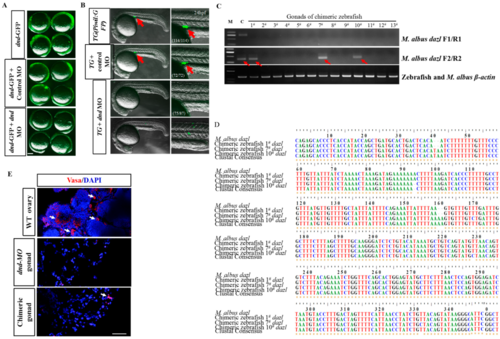
Figure 5. GSCs contribute to the germline cell lineage of host embryosto generate zebrafish germline chimeras. (A) The dnd MO abolished the expression of dnd-GFP reporter, whereas the control MO did not. (B) Images showing GFP signals in embryos injected with control and dnd MOs. The GFP-positive PGCs (red arrows) were distributed in the gonadal region of the Tg(piwil1:eGFP) embryos or embryos injected with control MO. No GFP-positive PGCs were observed in the gonadal region of embryos injected with dnd MO. The frequency of embryos with the indicated phenotypes was shown in the bracket of each group. Lateral view. Scale bars, 500 μm. (C) Gel images of RT-PCR products showing the expression of the eel-specific dazl gene in gonads of transplanted zebrafish. β-actin was used as a reference gene. Red arrows indicate PCR bands amplified by second-round RT-PCR. (D) Alignment of the amplified dazl sequences from gonads of M. albus and gonads of three fGSCs-transplanted zebrafish. (E) IF staining of Vasa in ovaries of control-, dnd MO-, and dnd MO-transplanted with fGSCs zebrafish. White arrows indicate the germ cells. Scale bar = 50 μm.
|
Acknowledgments
This image is the copyrighted work of the attributed author or publisher, and
ZFIN has permission only to display this image to its users.
Additional permissions should be obtained from the applicable author or publisher of the image.
Full text @ Int. J. Mol. Sci.