
Image
|
Figure Caption
Fig. 2
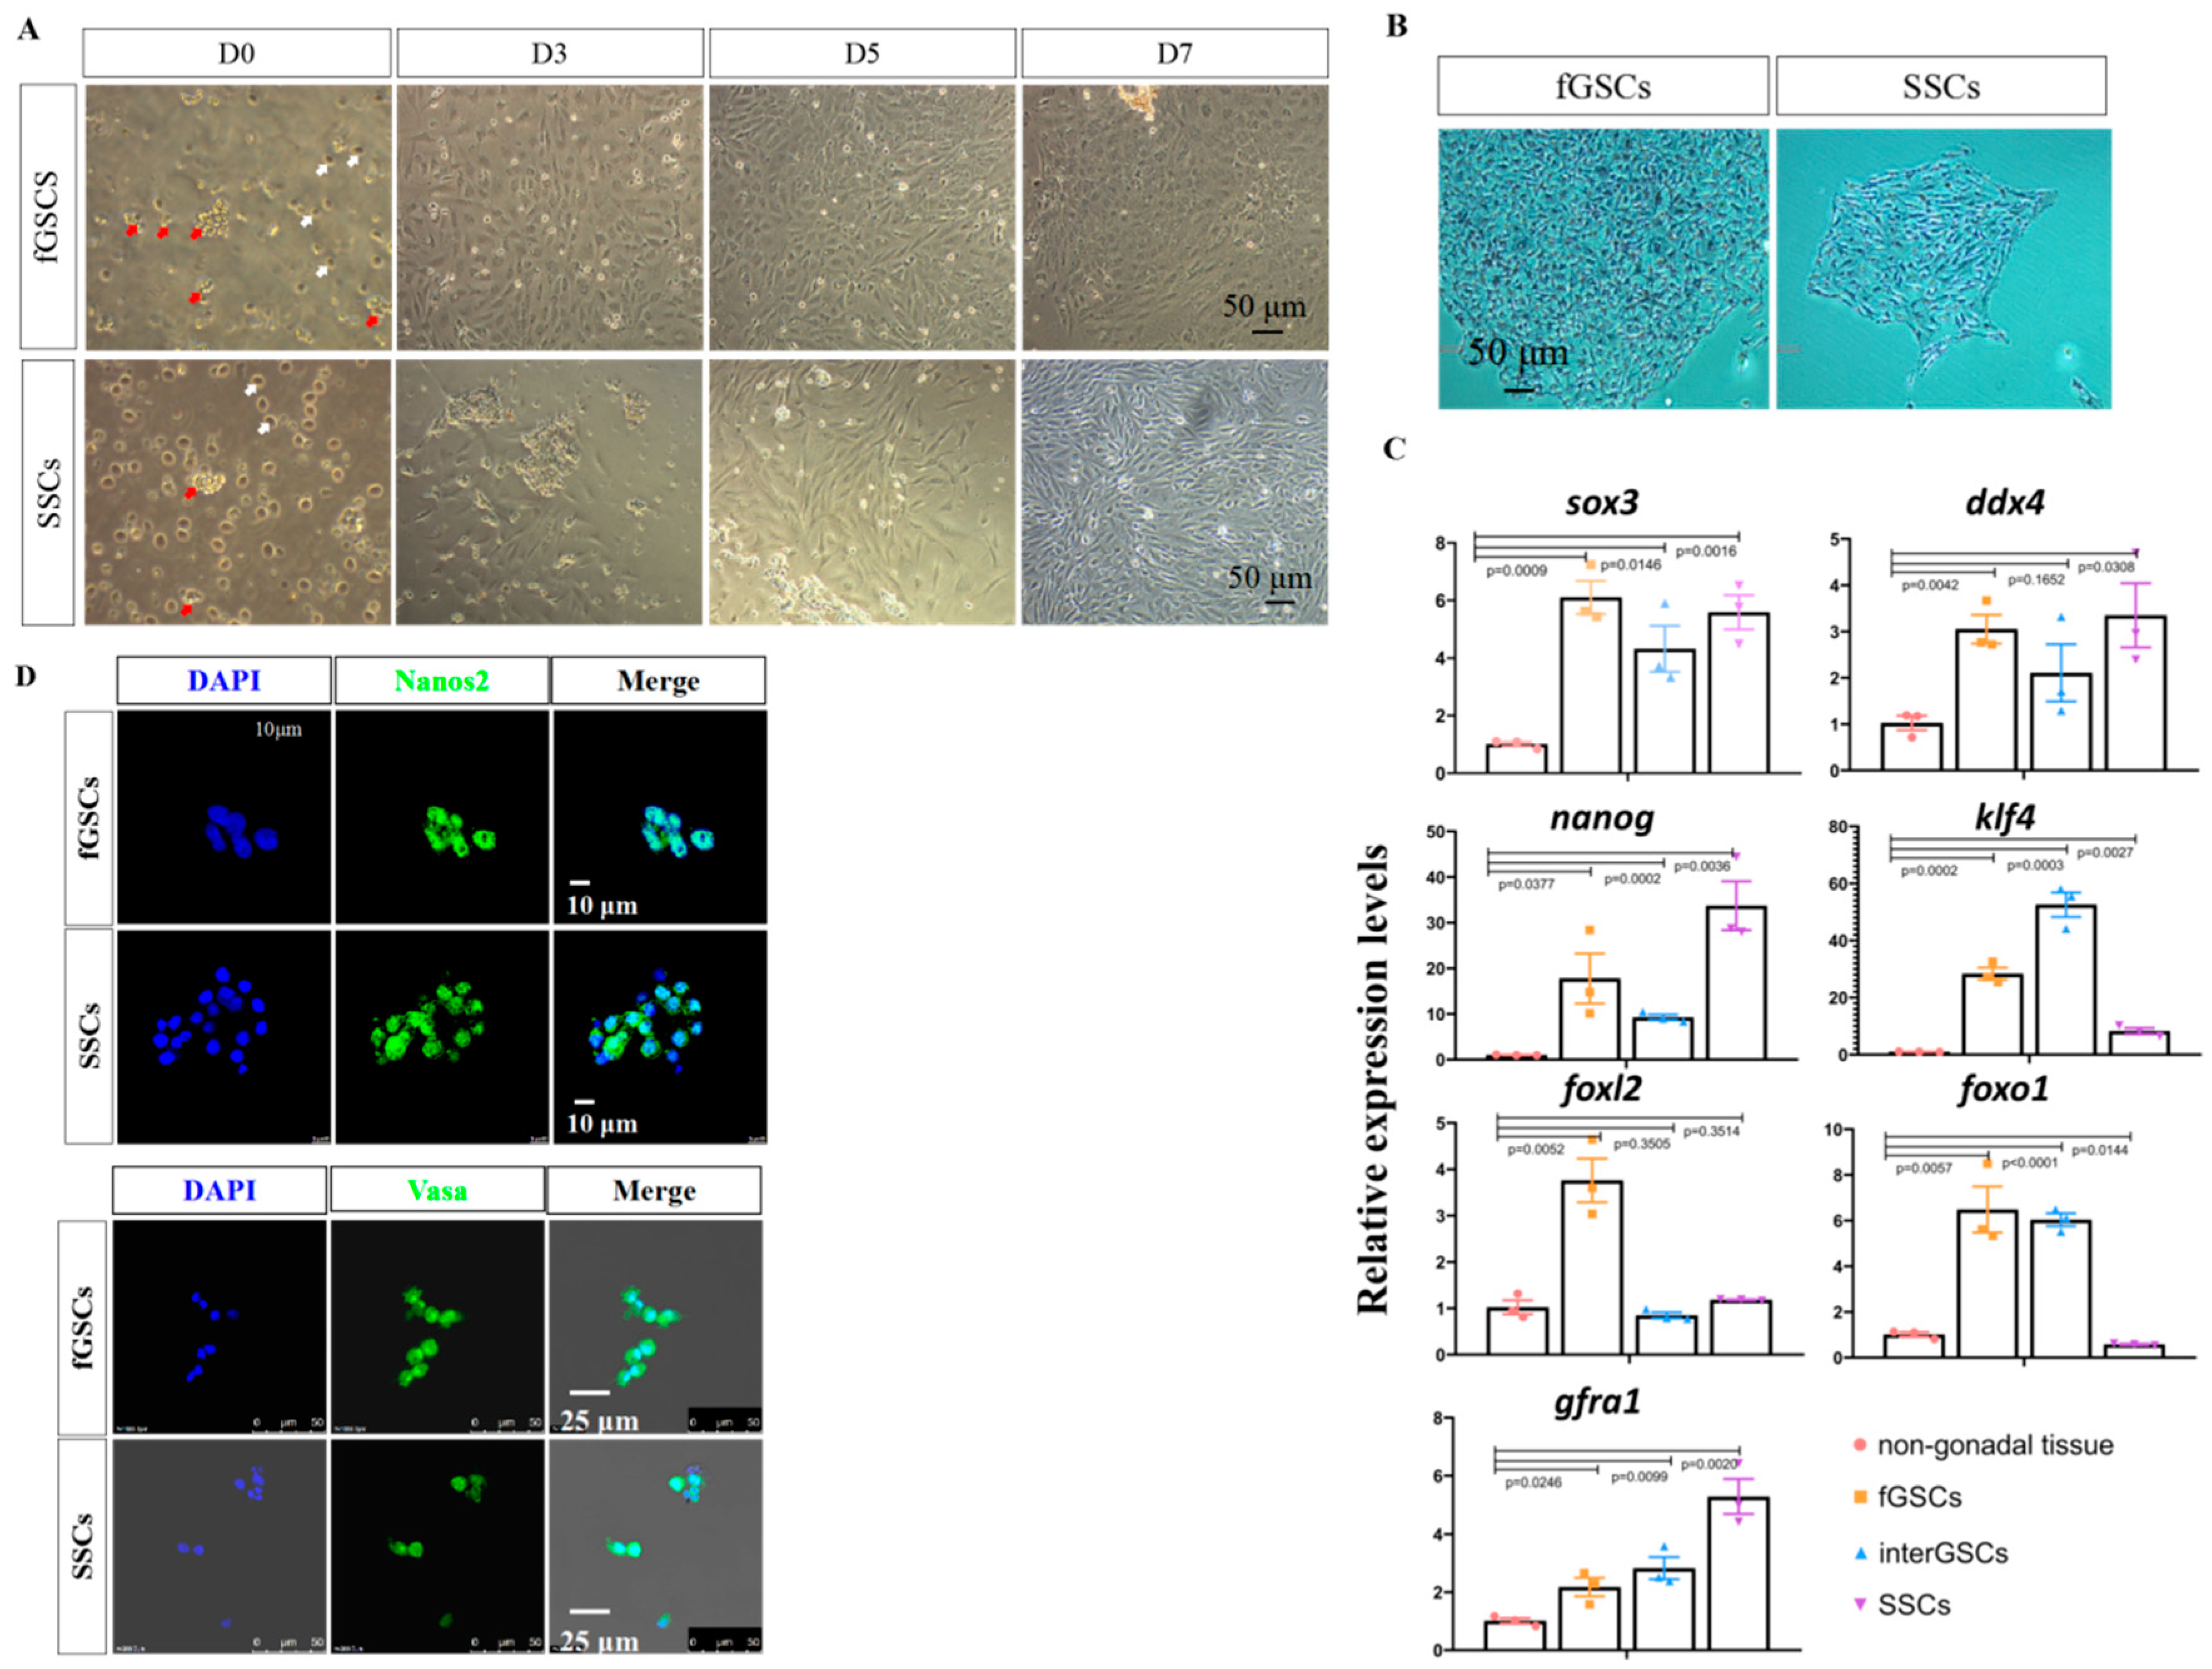
Figure 2. Isolation and characterization of GSCs derived from ovary and testis. (A) Cell morphology of GSCs isolated from ovary and testis at the indicated time points. Red arrows show the grape-like GSCs, and the white arrows show the blood cells. (B) AP staining images of fGSCs and SSCs. (C) qRT-PCR results of pluripotency- and GSC-specific genes in the isolated fGSCs, interGSCs, and SSCs. The spleen was used as the non-gonadal control. (D) Immunofluorescence staining results of Nanos2 and Vasa in fGSCs and SSCs.
Acknowledgments
This image is the copyrighted work of the attributed author or publisher, and
ZFIN has permission only to display this image to its users.
Additional permissions should be obtained from the applicable author or publisher of the image.
Full text @ Int. J. Mol. Sci.