
Image
|
Figure Caption
Fig. 4
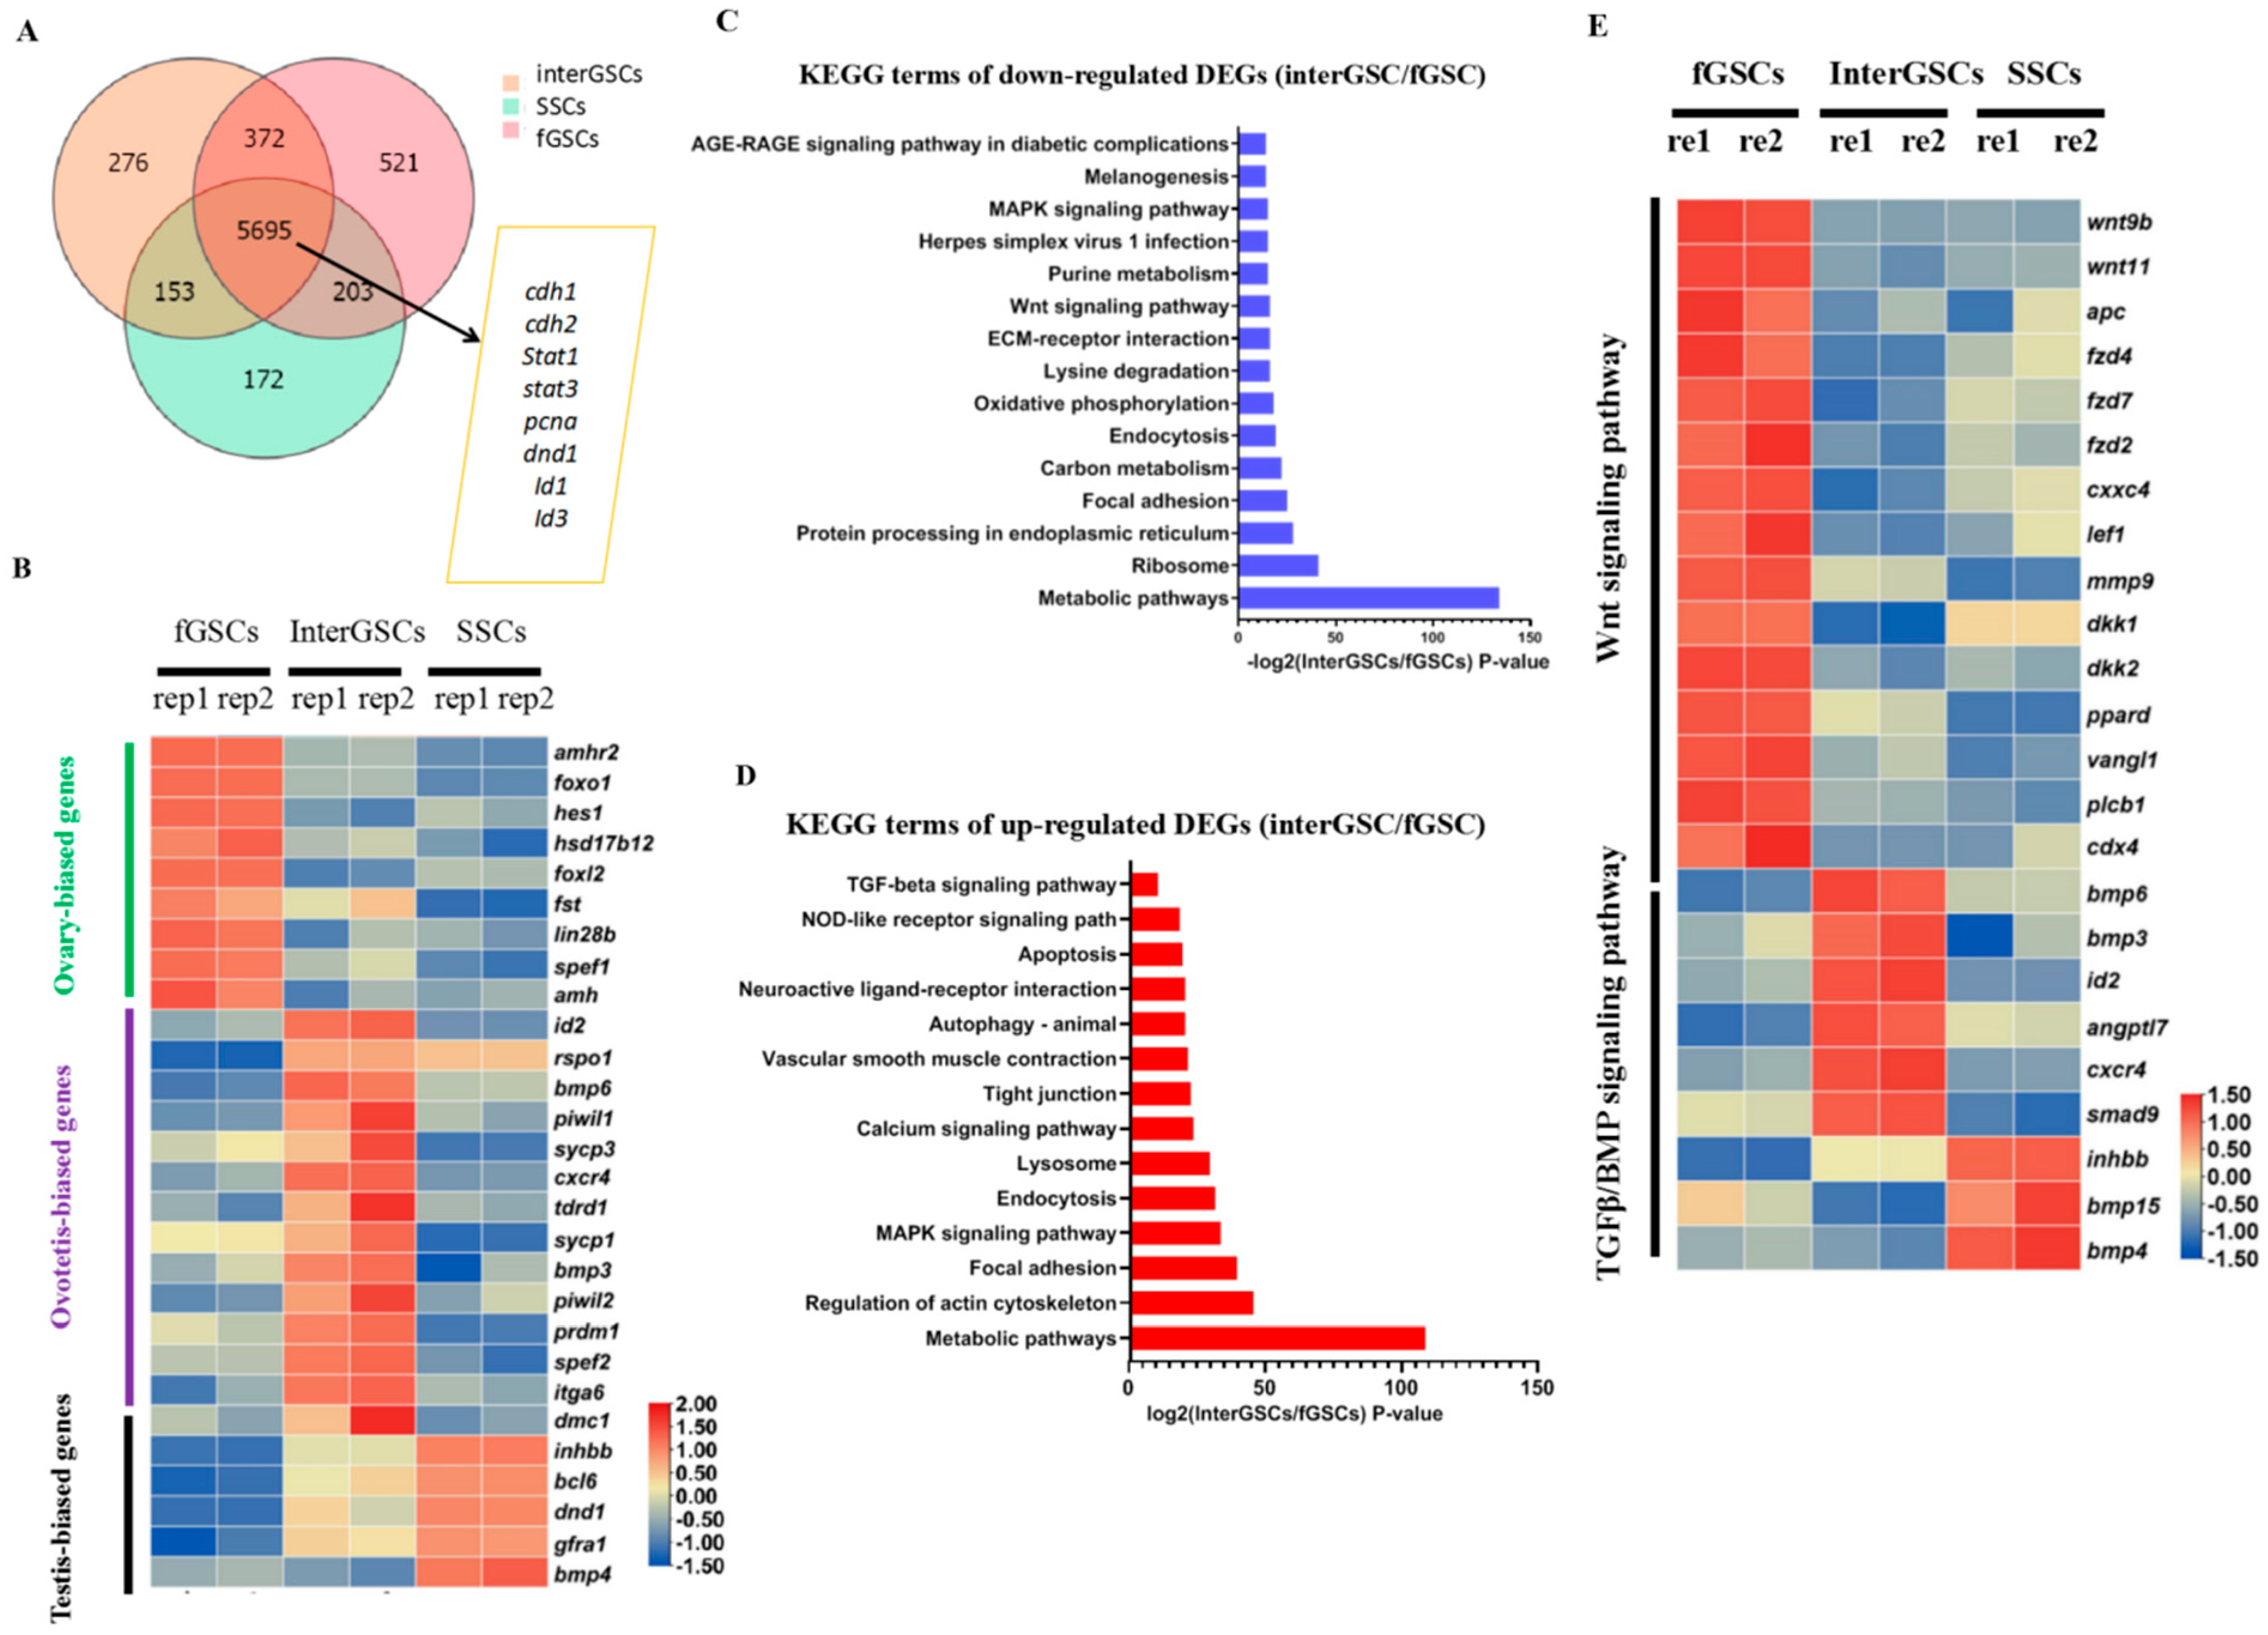
Figure 4. Transcriptome profiling of GSCs derived from ovary, ovotestis, and testis. (A) Venn diagram showing the numbers of overlapping genes among fGSCs, interGSCs, and mGSCs, FPKM > 10. (B) Heat map showing the expression of the indicated GSC-type specific genes. The color key from blue to red indicates the relative gene expression level from low to high. (C) KEGG of down-regulated DEGs in the interGSCs compared with the fGSCs. (D) KEGG of up-regulated DEGs in the interGSCs compared with the fGSCs. (E) Heat map showing the expression of Wnt- and Tgf-related genes in fGSCs, interGSCs, and SSCs. The color key from blue to red indicates the relative gene expression level, from low to high.
Acknowledgments
This image is the copyrighted work of the attributed author or publisher, and
ZFIN has permission only to display this image to its users.
Additional permissions should be obtained from the applicable author or publisher of the image.
Full text @ Int. J. Mol. Sci.