FIGURE SUMMARY
Title

Human α-Defensin-6 Neutralizes Clostridioides difficile Toxins TcdA and TcdB by Direct Binding

Authors
Barthold, L., Heber, S., Schmidt, C.Q., Gradl, M., Weidinger, G., Barth, H., Fischer, S.
Source
Full text @ Int. J. Mol. Sci.

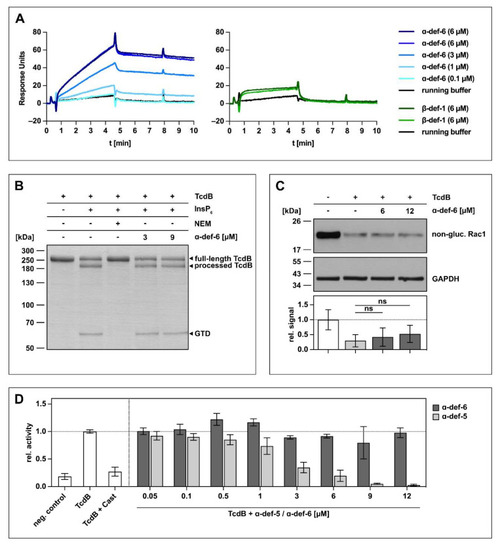
α-def-6 directly binds to TcdB in vitro but does not affect the autoproteolytic- and glucosyltransferase activity of TcdB. (A) 2400 RUs of biotinylated TcdB were immobilized via streptavidin-biotin binding onto a streptavidin sensor chip, and α-def-6 (concentrations as indicated) was applied to the chip for 4 min followed by a dissociation phase with a flow of running buffer. A solution of 6 µM of α-def-6 was injected twice to assess reproducibility, and β-def-1 (6 µM) served as a control. The flow rate was 25 µL/min. (B) The autoproteolytic activity of TcdB (2 µg) in the presence of InsP6 (1 mM) was evaluated in the absence or presence of α-def-6 (3 µM, 9 µM). N-ethylmaleimide (NEM; 1 mM), an inhibitor of the autoproteolytic activity of TcdB, was included as the control. After 1 h incubation at 37 °C, the samples were subjected to SDS-PAGE, and the protein was visualized by Coomassie staining. A representative gel is shown (n = 2). (C) CaCo-2 cell lysate (40 µg) as source of Rac1 was incubated with TcdB (50 ng) in the absence or presence of α-def-6 (6 µM, 12 µM) for 2 h at 37 °C. After SDS-PAGE and Western blotting, non-glucosylated Rac1 was detected with a specific antibody. GAPDH served as the loading control. A representative Western blot is shown. Relative signal intensities normalized to loading control are given as mean ± SD of four biological replicates, each with two technical duplicates (n = 4). Significance was tested with a one-way ANOVA combined with Dunnett’s multiple comparison test (ns = not significant p > 0.05). (D) UDP-GloTM glucosyltransferase assay was performed to analyze the glucosyltransferase activity of TcdB. TcdB (200 pM) was incubated with α-def-5 or α-def-6 (concentrations as indicated) in the presence of recombinant Rac1 (5 µM) as substrate. Castanospermine (Cast; 10 mM), a known inhibitor of the glucosyltransferase activity, was included as a control. Reactions were started with the addition of UDP-glucose (100 µM) and allowed to proceed for 1 h at 37 °C. Samples were combined with UDP detection reagent, and luminescence was measured. Values represent mean ± SD of at least three biological replicates, each with three technical replicates (n ≥ 3).

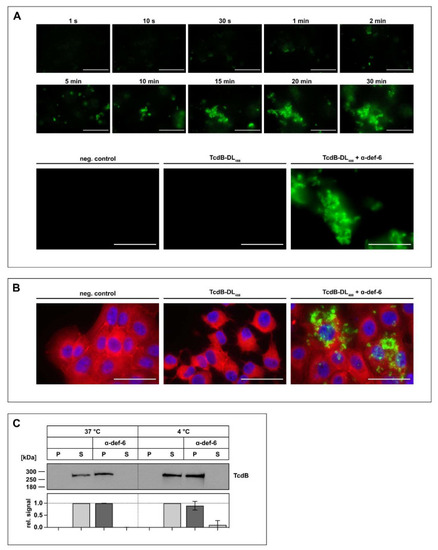
The incubation of α-def-6 and TcdB leads to rapid aggregation. (A) α-def-6 (6 µM) was added to TcdB-DL488 (30 nM) in PBS, and image acquisition with an epifluorescence microscope was started immediately. Aggregation was allowed to proceed for 0.5 h at 37 °C while images were being taken. Representative images of various time points are depicted to show the rapid progression of aggregation over time (upper panel). TcdB-DL488 (30 nM) alone in PBS was used as a positive control, while the same volume of Dylight488 treated PBS in PBS served as a negative control. Images after 0.5 h at 37 °C are depicted (lower panel), (n ≥ 2). (B) Vero cells were intoxicated with TcdB-DL488 (22 nM) in the absence or presence of α-def-6 (6 µM) for 0.5 h at 37 °C. Cells subjected to the same volume of DyLight488-treated PBS, as used TcdB-DL488, served as control. Cells were fixed and permeabilized. Nuclei (blue) were stained with Hoechst33342 and actin (red) with SiR-actin. Representative images taken with an epifluorescence microscope are depicted (n = 2). Scale bars correspond to 50 µm. (C) TcdB (50 ng) was incubated with or without α-def-6 (6 µM) in PBS for 0.5 h at 37 °C. Samples were centrifuged to segregate aggregates and divided into a supernatant (S) and pellet (P) fraction. Fractions were subjected to SDS-PAGE followed by Western blotting. TcdB was detected. Signals were analyzed as the ratio of one fraction (P or S) to the entire sample (P + S) and are depicted as mean ± SD of three biological replicates (n = 3).

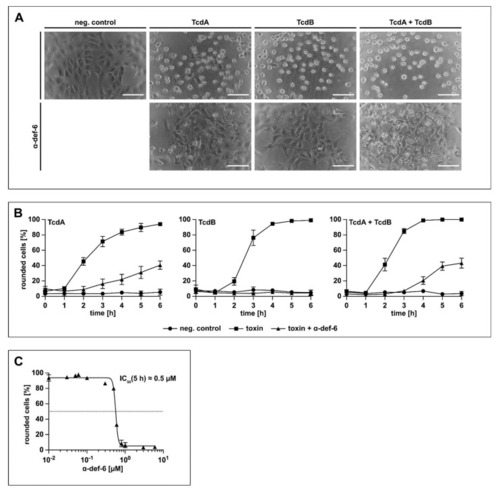
α-def-6 protects Vero cells from intoxication with TcdA, TcdB and the combination of both toxins. (A) Vero cells were intoxicated with TcdA (20 pM), TcdB (10 pM) or the combination of both toxins in the presence or absence of α-def-6 (6 µM). For control, the cells were left untreated. Representative images after 6 h incubation time are shown (n = 3). Scale bars correspond to 100 µm. (B) Vero cells were treated as in (A). The amount of rounded, i.e., intoxicated cells was determined hourly. Values are given as mean ± SD of three technical replicates. Three biological replicates exhibited comparable intoxication and inhibition (n = 3). (C) The concentration-dependent inhibition of TcdB (10 pM) was analyzed by incubating Vero cells with a concentration series of α-def-6 (ranging from 0.01 µM to 6 µM). After 5 h, images were taken, and the percentage of rounded cells was determined. Depicted is the mean ± SD of three technical replicates. Nonlinear fit was applied with GraphPad Prism via log(inhibitor) vs. response (variable slope, four parameters). Under this defined condition, an estimated IC50 value of about 0.5 µM was measured. The value was derived from three biological replicates, each with three technical replicates (n = 3).

α-def-6 inhibits intracellular Rac1 glucosylation by TcdA, TcdB and the combination of both toxins. (A) Vero cells were treated with TcdA (20 pM), TcdB (10 pM) or the combination of both toxins with or without the addition of α-def-6 (concentrations as indicated) for 5 h (TcdB) or 4 h (TcdA and TcdA + TcdB), respectively. Then, the cells were harvested, lysed and subjected to SDS-PAGE followed by Western blotting. Non-glucosylated Rac1 was detected and signals were normalized to GAPDH as loading control. Representative Western blots are depicted. Relative signal intensities are given as mean ± SD of at least three biological replicates (n ≥ 3). Significance was tested with one-way ANOVA combined with Dunnett’s multiple comparison test (* p < 0.05, *** p < 0.001). (B) Vero cells were treated as in (A). α-def-6 (6 µM) was used alone for control. After 4 h, cells were fixed and permeabilized. Non-glucosylated Rac1 (red) was stained with an anti-Rac1-antibody in combination with a secondary Alexa Fluor633-conjugated antibody. Actin (green) was stained with phalloidin-FITC and nuclei (blue) via Hoechst33342. Representative images are shown (n = 2). Scale bars correspond to 50 µm.

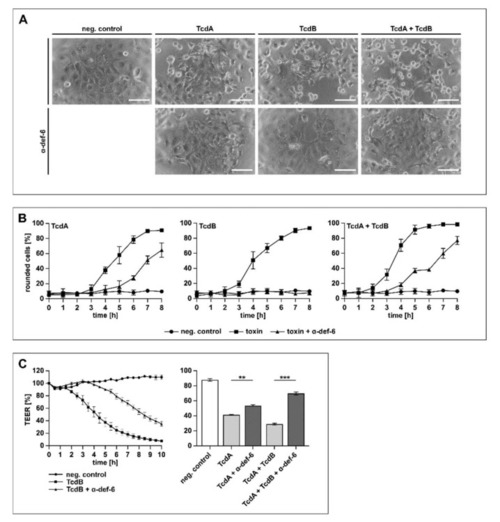
α-def-6 protects human CaCo-2 cells from intoxication with TcdA, TcdB and their combination. (A) CaCo-2 cells were treated with TcdA (500 pM), TcdB (50 pM) or the combination of both toxins in the presence and absence of α-def-6 (6 µM). For control, the cells were left untreated. Representative images after 6 h of incubation time are shown. Scale bars correspond to 100 µm. (B) CaCo-2 cells were treated as in (A). Images were taken each hour, and the amount of rounded cells over time was determined. Values are given as mean ± SD of three technical replicates. Three biological replicates showed comparable intoxication and inhibition (n = 3). (C) Transepithelial electrical resistance (TEER) was measured across a CaCo-2 monolayer. Cells were seeded in cell culture inserts (for TcdB: Millicell; for TcdA and TcdA + TcdB: Brand), and the toxins and α-def-6 (6 µM) were added apically. For TcdB (100 pM), a time-dependent protection of the CaCo-2 monolayer in the presence of α-def-6 is displayed (left panel). For TcdA (200 pM) and TcdA + TcdB, data after 2 h are shown (right panel). Values are given as mean ± SD. Significance was determined using a one-way ANOVA combined with a Dunnett’s multiple comparison test (** p < 0.01, *** p < 0.001). Three biological replicates showed comparable results (n = 3).

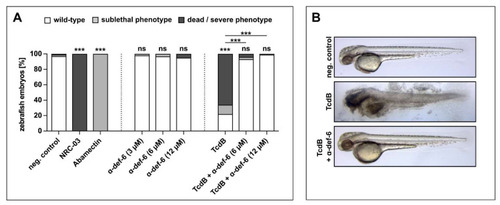
α-def-6 rescues zebrafish embryos from severe TcdB-induced damage and shows no self-toxicity. (A) Zebrafish embryos were incubated with TcdB (25 nM), α-def-6 or both. As negative control, embryos were subjected to the respective volume of solvent (PBS). NRC-03 (6 µM) served as a positive control for cytotoxicity, while Abamectin (3.125 µM) causes neurotoxicity. After 24 h of incubation, embryos (48 h post fertilization) were visually scored and categorized according to Supplementary Figure S1E. Embryos that displayed many necrotic cells (category Nec2), strong tissue damage (L3) or complete lysis (L4) and thus were dead at the time of analysis are plotted as “dead/severe phenotype”. Sublethal phenotypes comprise weaker cytotoxicity (limited necrosis or lysis), developmental toxicity (malformations or developmental delay), cardiotoxicity (impaired circulation or heart edema) and neurotoxicity (reduced escape movement). Data from three biological replicates are shown (two for α-def-6 only) (n = 90 embryos each, except for 60 for α-def-6 only and 75 for TcdB + α-def-6). Significance was tested using a Chi-Square test (ns = not significant, p > 0.05, *** p < 0.001). (B) Illustrative images displaying the typical wild-type appearance of neg. control- and rescue-embryos (TcdB + α-def-6 (12 µM)) and the strong tissue damage (L3) phenotype caused by TcdB (25 nM).

Acknowledgments
This image is the copyrighted work of the attributed author or publisher, and ZFIN has permission only to display this image to its users. Additional permissions should be obtained from the applicable author or publisher of the image. Full text @ Int. J. Mol. Sci.