IMAGE

Figure 5

ID
ZDB-IMAGE-220518-77
Source
Figures for Barthold et al., 2022
Image
Figure Caption

Figure 5

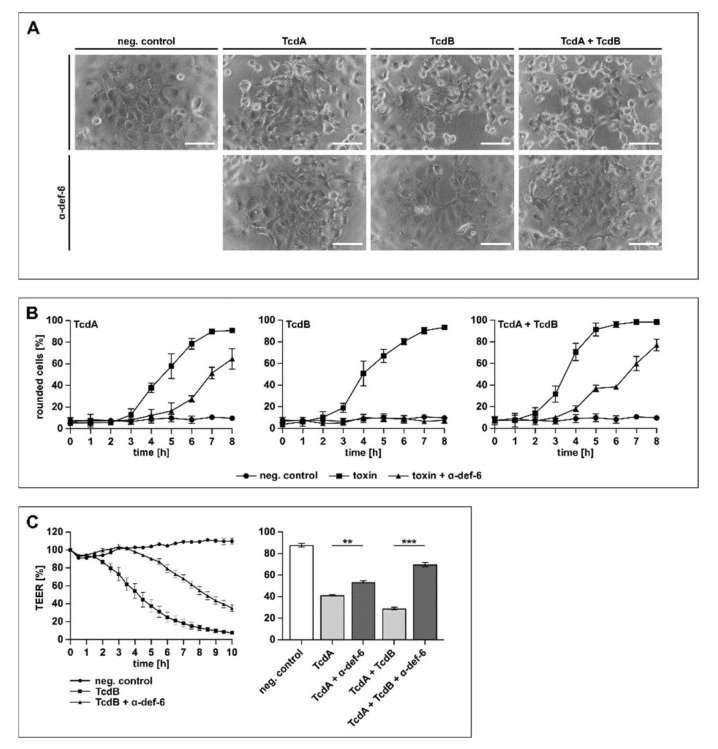
α-def-6 protects human CaCo-2 cells from intoxication with TcdA, TcdB and their combination. (A) CaCo-2 cells were treated with TcdA (500 pM), TcdB (50 pM) or the combination of both toxins in the presence and absence of α-def-6 (6 µM). For control, the cells were left untreated. Representative images after 6 h of incubation time are shown. Scale bars correspond to 100 µm. (B) CaCo-2 cells were treated as in (A). Images were taken each hour, and the amount of rounded cells over time was determined. Values are given as mean ± SD of three technical replicates. Three biological replicates showed comparable intoxication and inhibition (n = 3). (C) Transepithelial electrical resistance (TEER) was measured across a CaCo-2 monolayer. Cells were seeded in cell culture inserts (for TcdB: Millicell; for TcdA and TcdA + TcdB: Brand), and the toxins and α-def-6 (6 µM) were added apically. For TcdB (100 pM), a time-dependent protection of the CaCo-2 monolayer in the presence of α-def-6 is displayed (left panel). For TcdA (200 pM) and TcdA + TcdB, data after 2 h are shown (right panel). Values are given as mean ± SD. Significance was determined using a one-way ANOVA combined with a Dunnett’s multiple comparison test (** p < 0.01, *** p < 0.001). Three biological replicates showed comparable results (n = 3).

Acknowledgments
This image is the copyrighted work of the attributed author or publisher, and ZFIN has permission only to display this image to its users. Additional permissions should be obtained from the applicable author or publisher of the image. Full text @ Int. J. Mol. Sci.