IMAGE

Figure 6

ID
ZDB-IMAGE-220518-78
Source
Figures for Barthold et al., 2022
Image
Figure Caption

Figure 6

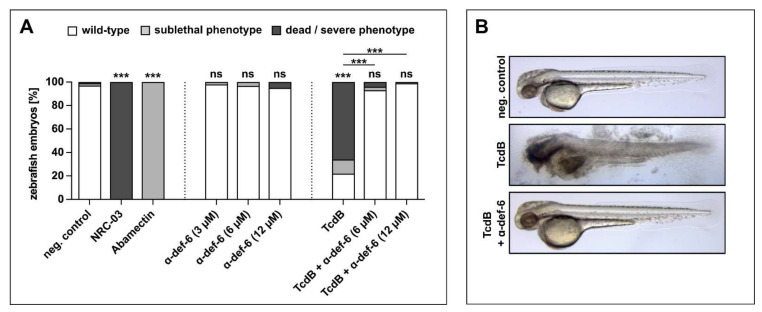
α-def-6 rescues zebrafish embryos from severe TcdB-induced damage and shows no self-toxicity. (A) Zebrafish embryos were incubated with TcdB (25 nM), α-def-6 or both. As negative control, embryos were subjected to the respective volume of solvent (PBS). NRC-03 (6 µM) served as a positive control for cytotoxicity, while Abamectin (3.125 µM) causes neurotoxicity. After 24 h of incubation, embryos (48 h post fertilization) were visually scored and categorized according to Supplementary Figure S1E. Embryos that displayed many necrotic cells (category Nec2), strong tissue damage (L3) or complete lysis (L4) and thus were dead at the time of analysis are plotted as “dead/severe phenotype”. Sublethal phenotypes comprise weaker cytotoxicity (limited necrosis or lysis), developmental toxicity (malformations or developmental delay), cardiotoxicity (impaired circulation or heart edema) and neurotoxicity (reduced escape movement). Data from three biological replicates are shown (two for α-def-6 only) (n = 90 embryos each, except for 60 for α-def-6 only and 75 for TcdB + α-def-6). Significance was tested using a Chi-Square test (ns = not significant, p > 0.05, *** p < 0.001). (B) Illustrative images displaying the typical wild-type appearance of neg. control- and rescue-embryos (TcdB + α-def-6 (12 µM)) and the strong tissue damage (L3) phenotype caused by TcdB (25 nM).

Acknowledgments
This image is the copyrighted work of the attributed author or publisher, and ZFIN has permission only to display this image to its users. Additional permissions should be obtained from the applicable author or publisher of the image. Full text @ Int. J. Mol. Sci.