FIGURE SUMMARY
Title

Diurnal changes in the efficiency of information transmission at a sensory synapse

Authors
Moya-Díaz, J., James, B., Esposti, F., Johnston, J., Lagnado, L.
Source
Full text @ Nat. Commun.

Differential regulation of luminance sensitivity and contrast sensitivity.

A Left: Retina of a Ribeye:SyGCaMP2 fish with box over the inner plexiform layer (IPL). Right: expansion of the boxed region showing terminals of bipolar cells. Zebrafish larvae were 7–9 days post-fertilization. B Averaged responses from ON terminals to light steps of different irradiance measured at Zeitgeber time 1, 6  and 10 hours. Note large variations in amplitude and kinetics. The full-field light stimuli were generated by an amber LED (lmax = 590 nm) which will most effectively stimulate red and green cones. Each light step lasted 3 s (n = 535 terminals from 10 fish). C Peak response as a function of irradiance for ON terminals in (B). The smooth lines are Hill functions of the form R = Rmax*(Ih/(Ih + I1/2h)), where R is the peak response, I is the irradiance, h is the Hill coefficient and I1/2 is the irradiance generating the half-maximal response. At ZT = 6 h: Rmax = 0.91 ± 0.04; h = 2.0 ± 0.2; I1/2 = 0.066 ± 0.02 nW/mm2 (dashed blue arrow). At ZT = 10 h: Rmax = 0.85 ± 0.06; h = 0.8 ± 0.1; I1/2 = 0.65 ± 0.18 nW/mm2. At ZT = 1 h: Rmax = 0.853 ± 0.02; h = 0.9 ± 0.2; I1/2 = 0.88 ± 0.18 nW/mm2 (dashed red arrow). D Variations in luminance sensitivity as a function of Zeitgeber time averaged across both ON and OFF terminals (n = 535 and 335 terminals, respectively). The lower bar shows the timing of the light-dark cycle. Error bars are ± 1 SD. E Averaged responses to stimuli of different contrasts (i.e. sinusoidal modulations in light intensity around a mean) measured at Zeitgeber time 4, 7 and 13 h averaged across both ON and OFF terminals (n = 949 from 21 fish). F Peak response amplitude as a function of contrast for terminals shown in E. The smooth lines are Hill functions used to interpolate values of C1/2, the contrast generating the half-maximal response. Note the diurnal variations. At ZT = 4 h: C1/2 = 86 ± 2% (dashed red arrow); h = 7.0 ± 1.2. At ZT = 7 h: C1/2 = 35 ± 2% (dashed black arrow); h = 2.7 ± 0.2. At ZT = 13 h: C1/2 = 72 ± 2%; h = 3.3 ± 0.2 (dashed blue arrow). G Variations in contrast sensitivity as a function of Zeitgeber time averaged across ON and OFF terminals (n = 949 from 21 fish). Note the peak around ZT = 7 h which is not mirrored in the diurnal variation in luminance sensitivity (D). The grey bars show the periods described as “morning” and “afternoon”. All error bars show ± 1 s.e.m. except for (D) which is ± 1 SD. Source data are provided as a Source Data file.

Diurnal modulation of synaptic gain.

A Multiphoton section through the eye of a zebrafish larva (7 dpf) expressing iGluSnFR in a subset of bipolar cells. B Examples of iGluSnFR signals from an individual OFF synapse elicited using stimuli of variable contrast modulated at 5 Hz (0–100%, full field, sine wave) in the morning (ZT 0–2 h, grey) and afternoon (ZT 6–8 h, black). Note the high levels of spontaneous activity in the morning (black arrowheads). In each case the top trace shows the iGluSnFR signal and the lower trace the estimated number of quanta composing each event (Qe). C Average contrast-response functions in OFF bipolar cell synapses in the morning (open circles; n = 20 synapses) and afternoon (closed; n = 59), where the response (R) was quantified as the average of quanta per cycle, Qc (i.e., the total number of quanta released within a single cycle of the sinusoidal stimulus). Each point shows the mean ± s.e.m. The smooth lines are fits of a sigmoid used for smoothing. Note the differences in the shape of the contrast-response functions and in the levels of spontaneous activity (zero contrast) (One-way ANCOVA test, p < 0.0006). D Average contrast-response functions in ON bipolar cell synapses in the morning (open circles; n = 12 synapses) and afternoon (closed; n = 31). There was no significant difference in the morning relative to afternoon. (One-way ANCOVA test, p = 0.53) Each point shows the mean ± s.e.m. E The contrast gain calculated as the derivative of the fits to the contrast-response functions in (C, D). The grey box provides an indication of the contrasts most common in nature (below about 40%). Note that the maximum contrast discrimination is increased by a factor of 2x in the OFF channel during the afternoon. Source data are provided as a Source Data file.

Diurnal changes in dopamine levels modulate synaptic transmission.

A Examples of iGluSnFR signals recorded in the afternoon from an individual OFF (red trace) and ON (green trace) synapses elicited using a stimulus of variable contrast before and after intravitreal injection of the D1 antagonist, SCH 23390 (black traces; estimated final concentration 20 nM). Note that SCH 23390 abolished synaptic responses at lower contrasts in ON and OFF synapses. In each case the top trace shows the iGluSnFR signal and the lower trace the estimated Qe. B Average contrast-response functions in OFF bipolar cell synapses after administration of D1 antagonist (black dots) in the afternoon and after administration of the D1 agonist ADTN in the morning (blue dots). Each point shows the mean ± s.e.m. (SCH 23390, n = 12 synapses; ADTN, n = 12 synapses). Control responses observed in the morning and afternoon are superimposed (red dots, from Fig. 2C). C Average contrast-response functions in ON bipolar cell synapses after intravitreal injection of D1 antagonist in the afternoon (black dots) and ADTN in the morning (blue dots). Each point shows the mean ± s.e.m. (SCH 23390, n = 7 synapses; ADTN, n = 5 synapses). Control responses observed in the morning and afternoon are superimposed (green dots, from Fig. 2D). D Relative response gain by diurnal modulation and after manipulation of dopaminergic signalling (dashed lines). Note that diurnal modulation of synaptic gain is higher in OFF synapses, whereas dopamine modulates the dynamic range by ~16-fold-change in ON and OFF synapses. Source data are provided as a Source Data file.

Diurnal modulation of spontaneous synaptic noise.

ATop: Example of iGluSnFR signals from an individual OFF synapse elicited using a stimulus of variable contrast in the morning (0–100%, 5 Hz modulation). In this example, note the high levels of spontaneous activity that were quantified as the responses elicited at zero contrast (red dashed box). Bottom. Examples of iGluSnFR signals from the same OFF synapse after intravitreal injection of ADTN. Note the increase in amplitude and frequency of events and the reduction of spontaneous activity. In each case the top trace shows the iGluSnFR signal and the lower trace the estimated Qe. B Quantification of spontaneous events composed by different Qe in OFF synapses in the morning, morning + ADTN and afternoon (OFF morning, n = 20 synapses; OFF morning + ADTN n = 12 synapses; OFF afternoon, n = 24 synapses). Note the suppression of spontaneous events in OFF synapses after intravitreal injection of ADTN in the morning. Each point shows the mean ± s.e.m. C Quantification of spontaneous events composed by different Qe in ON synapses in the Morning, Morning + ADTN and Afternoon (ON Morning n = 12 synapses; ON Morning + ADTN n = 5 synapses; ON Afternoon, n = 17 synapses). Note that spontaneous activity levels were not dramatically altered after administration of ADTN. Each point shows the mean ± s.e.m. Source data are provided as a Source Data file.

Diurnal changes in the variability of stimulus-evoked responses.

A Examples of iGluSnFR signals from individual OFF synapses in the morning and afternoon. Responses elicited by stimuli of 60% and 40% contrast varied from cycle to cycle of the 5 Hz stimulus. In each case the top trace shows the iGluSnFR signal and the lower trace the estimated Qe. B Variability in the response of OFF synapses calculated as the Fano factor, with each response measured as the total number of vesicles released over one cycle at each contrasts. Comparison is made between the morning (n = 18), afternoon (n = 27) and the morning after injection of ADTN (n = 13). Each point shows the mean ± s.e.m. C As in B, but for ON synapses (n = 12, 15 and 6 synapses for respective conditions). D Average Fano factor over different contrasts in OFF synapses in the three conditions described above. Data from (B, C). Overall, the average Fano factor was significantly higher in the morning compared to afternoon or in the morning after injection of ADTN (One-Way ANOVA; p < 0.0001). Open red dots represent individual values. Error bars show ± s.e.m. E As (D), but for ON synapses. Again, the average Fano factor was significantly higher in the morning (One-Way ANOVA; p < 0.0001). Open green dots represent individual values. Error bars show ± s.e.m. Source data are provided as a Source Data file.

The temporal precision of vesicle release is under diurnal control in the OFF channel.

A Example recordings from two OFF synapses stimulated at 60% contrast in three conditions: afternoon (top, red trace), morning (middle, light red trace) and after intravitreal injection of ADTN in the morning (bottom, blue trace). Morning and morning + ADTN synaptic responses are from the same synapse. The modulation in intensity (5 Hz, sine wave) is shown below. Arrowheads highlight events occurring at different phases of the stimulus, with less variation with events composed for 4 or more quanta in the afternoon and after administration of ADTN in the morning. In each case the top trace shows the iGluSnFR signal and the lower trace the estimated Qe. B Temporal jitter of events composed of different numbers of quanta in OFF synapses in the afternoon (red dots; n = 24 synapses); Morning (open red dots; n = 19 synapses) and Morning + ADTN (blue dots, n = 16). Note that during the morning events composed by multiple quanta were less phase-locked to the stimuli in comparison to the afternoon. Activation of D1 receptors had a significant effect on release of multiquantal events. Events composed by 5 or more quanta jittered by ~5 ms, similar to values observed in the afternoon (black dashed line). The solid lines describing these relations in the three conditions are better described by a single exponential decay function of the form y0 + Aexp((−(xx0)/τ))) with y0 = 4.23 ± 1.2 and A = 27 ± 7 in the afternoon; y0 = 9.77 ± 1.4 and A = 28.64 ± 5.6 in the morning and y0 = 5.45 ± 1.3, A = 30 ± 6.1 after activation of D1 receptor in the morning. Each point shows the mean ± s.e.m. C Temporal jitter of events composed by different numbers of quanta measured in ON synapses in the afternoon (green dots; n = 14 synapses) during the morning (open green dots; n = 10 synapses) and during Morning + ADTN, (blue dots; n = 6 synapses). Activation of D1 receptor did not have a significant effect in the temporal precision in the ON channel. The relationships observed in the different conditions were better described by a straight line. Morning a = 34.7 ± 1.5 and a slope = −3.6 ± 0.5; Afternoon: a = 25.1 ± 1.2 and a slope = −2.8 ± 0.2; Morning + ADTN: a = 34.9 ± 1.5 and a slope = −4.2 ± 0.3. Note that events composed of 8 or more quanta jittered by just ~4 ms (black dashed line). Each point shows the mean ± s.e.m. Source data are provided as a Source Data file.

Dopamine contributes to diurnal variations in the distribution of multivesicular events.

A Examples of iGluSnFR signals from individual OFF synapses elicited using 60% contrast stimulus (5 Hz, 30 s) in the morning (top), afternoon (middle) and afternoon + SCH 23390 (bottom). In each case the top trace shows the iGluSnFR signal and the lower trace the estimated Qe.B Changes in Qe in ON synapses in the morning (light grey bars, n = 10 synapses) and afternoon (green bars, n = 14 synapses). In the afternoon the distribution was shifted toward multiquantal events (p < 0.05, KS-test). C Changes in the distribution of Qe in ON synapses before and after intravitreal injection of the D1 antagonist SCH23390 (dark grey bars, n = 8 synapses). The distribution was shifted toward lower Qe (p < 0.001) but was not significantly different to that measured in the morning. D Changes in Qe, in OFF synapses in the morning (light grey bars, n = 19 synapses) and afternoon (red bars, n = 24 synapses). In the afternoon the distribution was shifted toward multiquantal events (p < 0.02). E Changes in the distribution of Qe in OFF synapses before and after intravitreal injection of SCH 23390 in the afternoon (dark grey bars, n = 12 synapses). The distribution was shifted toward uniquantal events (p < 0.001). Source data are provided as a Source Data file.

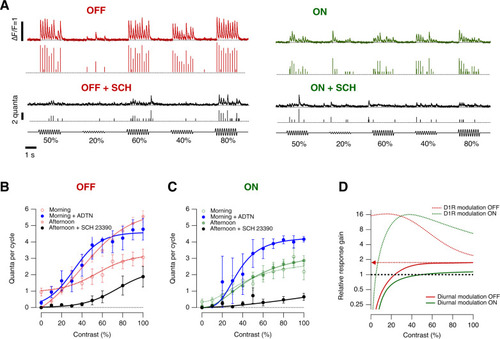
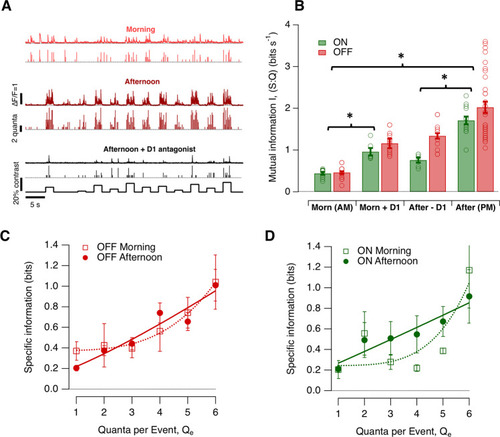
Diurnal changes in the efficiency with which synapses transmit visual information.

A Examples of synaptic responses over 11 different contrasts spanning ±10% around the contrast eliciting the half-maximal response (C1/2) in the morning (top, light red), afternoon (middle, dark red) and after injection of D1 antagonist SCH 23390 in the afternoon (bottom, black; note the lower frequency and amplitude of release events). In each case the top trace shows the iGluSnFR signal and the lower trace the estimated Qe. Each contrast step lasted 2 s (5 Hz) and each trace is from a different OFF synapse. B Mutual information I (S:Q) in four conditions: morning (Morn AM; OFF = 15 synapses, ON = 10 synapses), morning after injection of ADTN (Morn + D1; OFF = 14 synapses, ON = 6 synapses), afternoon after injection of SCH 23390 (After−D1; OFF = 12 synapses, ON = 6 synapses) and afternoon (After PM; OFF = 33 synapses, ON = 13 synapses). Differences between morning and afternoon were significant at p < 0.0001 (One-way ANOVA), as were the effects of drug manipulations. Bar graphs show the mean ± s.e.m. Individual values are represented by green and red open dots for ON and OFF synapses, respectively. C Specific information (I) for events of different quantal content in OFF synapses (morning, n = 15; afternoon, n = 33). The curve describing the relation are least-squares fit of a power function of the form I = y0 + AQex. In the morning, y0 = 0.38, A = 0.0017, x = 3.4. In the afternoon, y0 = 0.12, A = 0.10, x = 1.2. Each point shows the mean ± s.e.m. D As (C), but for ON synapses (morning, n = 10; afternoon, n = 13). In the morning, y0 = 0.24, A = 0.0003, x = 4.4. In the afternoon, y0 = 0.16, A = 0.11, x = 1.0. Each point shows the mean ± s.e.m. Source data are provided as a Source Data file.

Acknowledgments
This image is the copyrighted work of the attributed author or publisher, and ZFIN has permission only to display this image to its users. Additional permissions should be obtained from the applicable author or publisher of the image. Full text @ Nat. Commun.