IMAGE

Fig. 3

ID
ZDB-IMAGE-220517-5
Source
Figures for Moya-Díaz et al., 2022
Image
Figure Caption

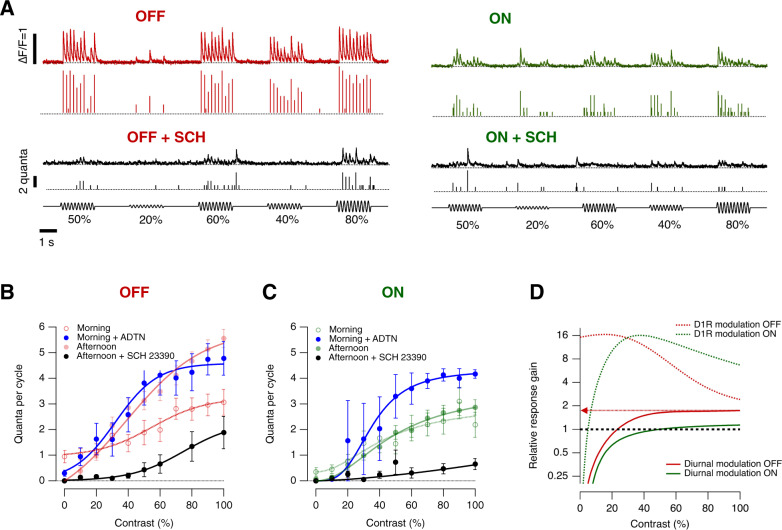
Fig. 3 Diurnal changes in dopamine levels modulate synaptic transmission.

A Examples of iGluSnFR signals recorded in the afternoon from an individual OFF (red trace) and ON (green trace) synapses elicited using a stimulus of variable contrast before and after intravitreal injection of the D1 antagonist, SCH 23390 (black traces; estimated final concentration 20 nM). Note that SCH 23390 abolished synaptic responses at lower contrasts in ON and OFF synapses. In each case the top trace shows the iGluSnFR signal and the lower trace the estimated Qe. B Average contrast-response functions in OFF bipolar cell synapses after administration of D1 antagonist (black dots) in the afternoon and after administration of the D1 agonist ADTN in the morning (blue dots). Each point shows the mean ± s.e.m. (SCH 23390, n = 12 synapses; ADTN, n = 12 synapses). Control responses observed in the morning and afternoon are superimposed (red dots, from Fig. 2C). C Average contrast-response functions in ON bipolar cell synapses after intravitreal injection of D1 antagonist in the afternoon (black dots) and ADTN in the morning (blue dots). Each point shows the mean ± s.e.m. (SCH 23390, n = 7 synapses; ADTN, n = 5 synapses). Control responses observed in the morning and afternoon are superimposed (green dots, from Fig. 2D). D Relative response gain by diurnal modulation and after manipulation of dopaminergic signalling (dashed lines). Note that diurnal modulation of synaptic gain is higher in OFF synapses, whereas dopamine modulates the dynamic range by ~16-fold-change in ON and OFF synapses. Source data are provided as a Source Data file.

Acknowledgments
This image is the copyrighted work of the attributed author or publisher, and ZFIN has permission only to display this image to its users. Additional permissions should be obtained from the applicable author or publisher of the image. Full text @ Nat. Commun.