|
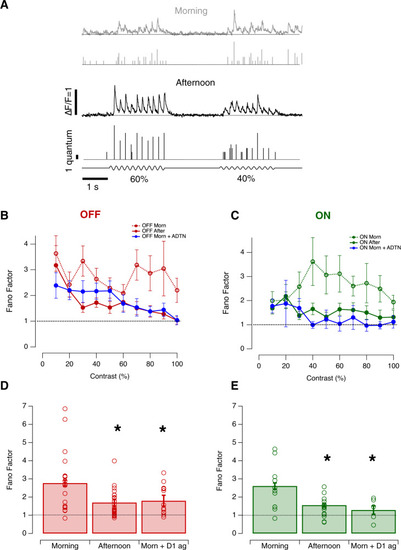
Diurnal changes in the variability of stimulus-evoked responses.A Examples of iGluSnFR signals from individual OFF synapses in the morning and afternoon. Responses elicited by stimuli of 60% and 40% contrast varied from cycle to cycle of the 5 Hz stimulus. In each case the top trace shows the iGluSnFR signal and the lower trace the estimated Qe. B Variability in the response of OFF synapses calculated as the Fano factor, with each response measured as the total number of vesicles released over one cycle at each contrasts. Comparison is made between the morning (n = 18), afternoon (n = 27) and the morning after injection of ADTN (n = 13). Each point shows the mean ± s.e.m. C As in B, but for ON synapses (n = 12, 15 and 6 synapses for respective conditions). D Average Fano factor over different contrasts in OFF synapses in the three conditions described above. Data from (B, C). Overall, the average Fano factor was significantly higher in the morning compared to afternoon or in the morning after injection of ADTN (One-Way ANOVA; p < 0.0001). Open red dots represent individual values. Error bars show ± s.e.m. E As (D), but for ON synapses. Again, the average Fano factor was significantly higher in the morning (One-Way ANOVA; p < 0.0001). Open green dots represent individual values. Error bars show ± s.e.m. Source data are provided as a Source Data file.
|