
- Title
-
Long-term obesogenic diet leads to metabolic phenotypes which are not exacerbated by catch-up growth in zebrafish
- Authors
- Leibold, S., Bagivalu Lakshminarasimha, A., Gremse, F., Hammerschmidt, M., Michel, M.
- Source
- Full text @ PLoS One
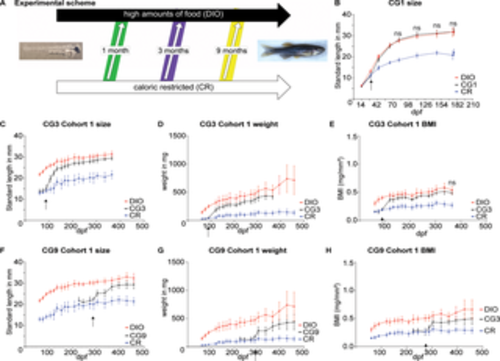
Fig 1. Compensatory growth can be induced in juvenile and adult zebrafish by excessive feeding following caloric restriction and results in compensation for differences in body length and BMI. (A) Scheme showing changes in feeding regime to induce compensatory growth (CG) in zebrafish with an age of one, three or nine months; (B) Standard length of fish undergoing CG at 1 month of age (arrow); (C, F): Standard Length; (D, G) body weight; (E, H) and body mass index of a cohort of fish (n = 10) undergoing CG at 3 months of age (C-E) and at 9 months of age (F, H); error bars indicate STDEV, ns indicates a lack of significant difference between the CG and the DIO group at that timepoint as indicated by a 2-Way ANOVA followed by Tukey’s multiple comparison test. |
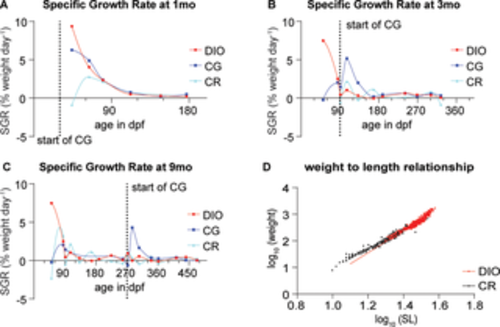
Fig 2. Growth rate and weight-length relationship in fish growing under different conditions. (A-C) Specific Growth rates (SGR) of fish fed under DIO, CG and CR conditions and undergoing CG at (A) one month of age, (B) 3 months of age (C) or 9 months of age. Data fit with an Akima spline curve; (D) The weight-length relationship of CR and DIO fish. The slope is significantly larger in the case of the DIO group compared to the CR group F(1, 970) = 133, p<0.0001. |
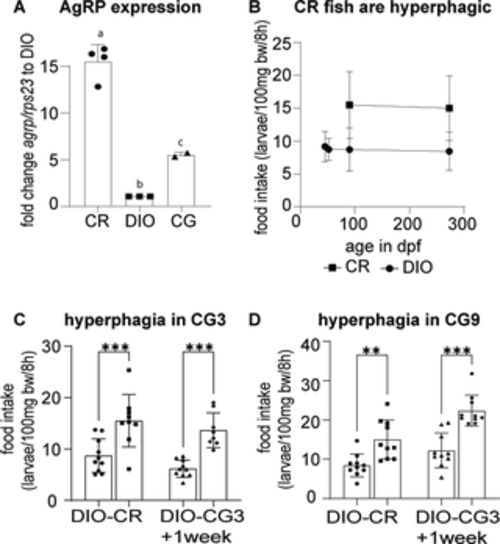
Fig 3. Fish undergoing CR and CG are hyperphagic. (A) agrp expression analysis of CR and DIO fish brains as well as CG9 fish brains 1–2 weeks after the shift to the obesogenic environment. Expression is standardized to rps23; (B) calorically restricted fish are severely hyperphagic when exposed to ad libitum feeding conditions compared to the DIO group that has been raised in an obesogenic environment; (C) CG3 fish are hyperphagic before (CR) transfer to DIO conditions as well as at least one week after transfer (CG3); (D) The CG9 group is similarly hyperphagic before as well as at least one week after the transfer to DIO conditions. Pooled data of male and female fish, n of 4–10; error bars indicate STDEV, groups were compared with ANOVA followed by Tukey’s multiple comparisons test (A) or an unpaired t-test (C, D), significance is indicated as * p<0.05, ** p<0.01 and *** p<0.001. |
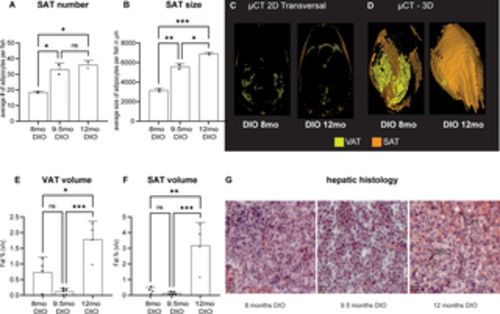
Fig 4. Adipose distribution under overfeeding conditions. (A) Subcutaneous adipose (SAT) cell number after 8 to 12 months of DIO; (B) average SAT adipocyte size after long-term DIO, Data from two representative male fish of the cohort; (C-F) Adult DIO fish of different ages and length on an obesogenic diet were compared for whole body adiposity using μCT imaging; (C) representative transverse section through DIO fish at 8 months and 12 months of age (D) representative three-dimensional volume rendering of visceral adipose tissue (VAT) and SAT; (E) quantification of VAT and (F) SAT, Data from 4–5 mixed gender fish and (G) representative hepatic histology of the 8, 9.5 and 12 month endpoints in DIO feeding conditions. Cryosections stained with hematoxylin for nuclei and oil red O (ORO) for lipids. Sections showed progressive signs of lesions indicative of steatohepatitis (SH). Error bars indicate STDEV, groups were compared with an ANOVA followed by Tukey’s multiple comparisons test, significance is indicated as * p<0.05, ** p<0.01 and *** p<0.001. |
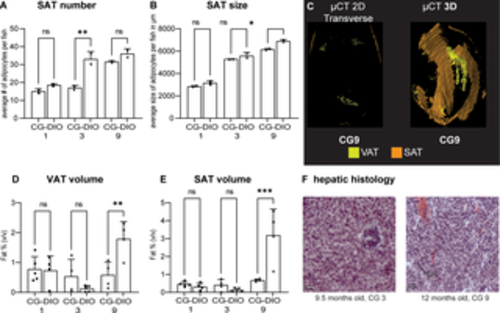
Fig 5. Early CG does not exacerbate DIO. Endpoint comparison of CG1, CG3 and CG9 animals with their respective DIO control groups at 8, 9.5 and 12 months respectively. (A) Subcutaneous adipocyte (SAT) number and (B) size. Data is from two representative male fish of the cohort; (C) CG1-9 fish were compared for whole body adiposity with DIO fish using μCT imaging; (D-E) quantification of visceral (VAT) and subcutaneous (SAT) adipose tissue by μCT, data from 4–5 mixed gender fish. (F) representative hepatic histology of the CG group stained with hematoxylin and oil red O (ORO). Sections show little ORO staining and few lesions (compare with Fig 4F). Error bars indicate STDEV, groups were compared with an ANOVA followed by Šídák’s multiple comparisons test, significance is indicated as * p<0.05, ** p<0.01 and *** p<0.001. |
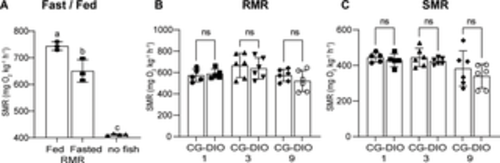
Fig 6. CG does not lead to changes in metabolic rate. (A) Shows the effect of fasting on resting metabolic rate in adult fish. RMR is lower during fasting conditions, n = 3 for fed and fasted, n of 4 for chambers without fish; (B) We compared CG1, CG3 and CG9 fish with their respective DIO control fish and found no difference in RMR; (C) We similarly found no difference in standard metabolic rate between the CG and the DIO control groups. n = 6 each, error bars indicate STDEV, groups were compared with an unpaired t-test (A) or an ANOVA followed by Šídák’s multiple comparisons test (B-C), significance is indicated as * p<0.05, ** p<0.01 and *** p<0.001. |
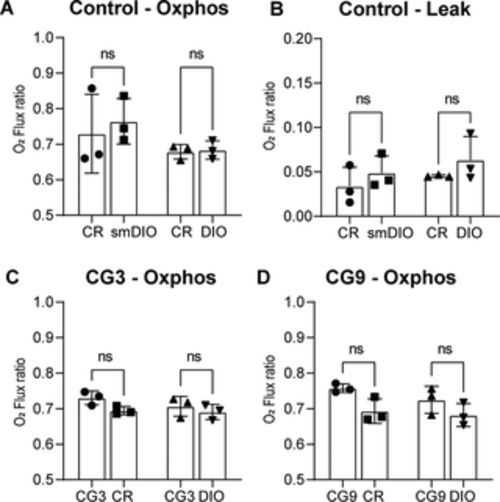
Fig 7. The shift to CG leads to an increase in maximal oxidative phosphorylation. (A) Due to the size difference between CR and DIO fish we tested age matched (CR and DIO) as well as size matched (CR and size matched (sm)DIO) maximal rate of oxidative phosphorylation and (B) the leakage of the mitochondrial membrane; (C-D) the maximal rate of oxidative phosphorylation in CG compared to control CR and compared to control DIO fish for (C) CG3 and (D) CG9; n = 3 for each group, error bars indicate STDEV, groups were compared with an ANOVA followed by Šídák’s multiple comparisons test. |
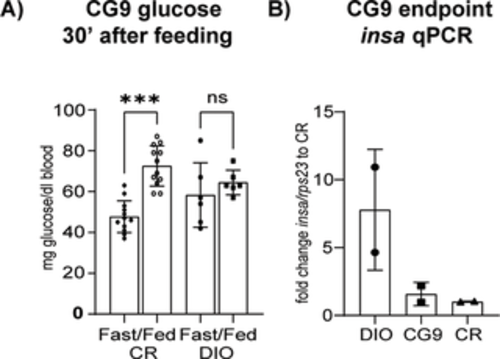
Fig 8. Glucoregulation at 9 months. (A) Blood glucose levels in fish fasted for 90 hours and tested 30 minutes after refeeding, CR n = 12 and DIO n = 6; (B) insa qPCR of whole fish body, n = 2; Error bars indicate STDEV, groups were compared with an ANOVA followed by Tukey’s multiple comparisons test (A) or Šídák’s multiple comparisons test (B-C), significance is indicated as * p<0.05, ** p<0.01 and *** p<0.001. |