
Fig. 4
- ID
- ZDB-FIG-220513-53
- Publication
- Leibold et al., 2022 - Long-term obesogenic diet leads to metabolic phenotypes which are not exacerbated by catch-up growth in zebrafish
- Other Figures
- All Figure Page
- Back to All Figure Page
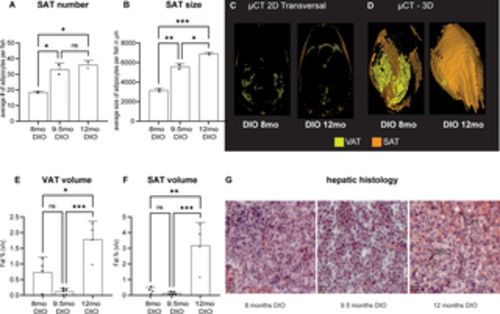
Fig 4. Adipose distribution under overfeeding conditions. (A) Subcutaneous adipose (SAT) cell number after 8 to 12 months of DIO; (B) average SAT adipocyte size after long-term DIO, Data from two representative male fish of the cohort; (C-F) Adult DIO fish of different ages and length on an obesogenic diet were compared for whole body adiposity using μCT imaging; (C) representative transverse section through DIO fish at 8 months and 12 months of age (D) representative three-dimensional volume rendering of visceral adipose tissue (VAT) and SAT; (E) quantification of VAT and (F) SAT, Data from 4–5 mixed gender fish and (G) representative hepatic histology of the 8, 9.5 and 12 month endpoints in DIO feeding conditions. Cryosections stained with hematoxylin for nuclei and oil red O (ORO) for lipids. Sections showed progressive signs of lesions indicative of steatohepatitis (SH). Error bars indicate STDEV, groups were compared with an ANOVA followed by Tukey’s multiple comparisons test, significance is indicated as * p<0.05, ** p<0.01 and *** p<0.001. |