
- Title
-
Single-cell profiling of transcriptome and histone modifications with EpiDamID
- Authors
- Rang, F.J., de Luca, K.L., de Vries, S.S., Valdes-Quezada, C., Boele, E., Nguyen, P.D., Guerreiro, I., Sato, Y., Kimura, H., Bakkers, J., Kind, J.
- Source
- Full text @ Mol. Cell
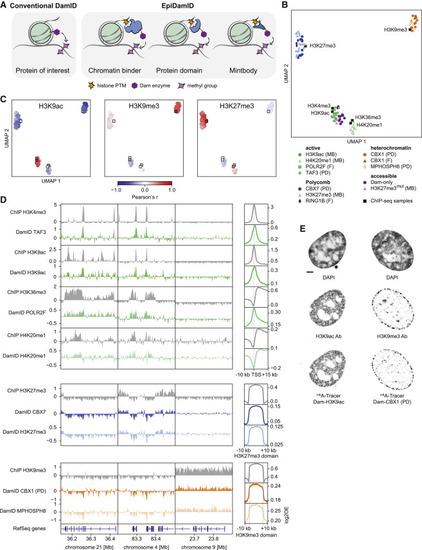
Figure 1. Targeting domains specific to histone modifications mark distinct chromatin types with EpiDamID (A) Schematic overview of EpiDamID concept compared to conventional DamID. (B) UMAP of DamID samples colored by targeting construct, and ChIP-seq samples of corresponding histone modifications. MB: mintbody; PD: protein domain; F: full protein. (C) UMAPs as in (B), colored by correlation with selected ChIP-seq samples (H3K9ac, H3K9me3, and H3K27me3). Correlation values reflect the Pearson’s correlation coefficient of Dam-normalized samples with the indicated ChIP-seq sample. Control constructs (Dam, H3K27me3mut) are excluded from the UMAP. DamID samples are circles; ChIP-seq samples are squares. (D) Left: three genome browser views of ChIP-seq (gray) and DamID (colored) enrichment. Data represent the combined signal of all samples of each targeting domain. Right: average DamID and ChIP-seq enrichment plots over genomic regions of interest. Signal is normalized for untethered Dam or input, respectively. Regions are the TSS (−10/+15 kb) of the top 25% H3K9ac-enriched genes for the active marks (top), and ChIP-seq domains (−/+ 10 kb) for H3K27me3 (middle), and H3K9me3 (bottom). (E) Confocal images of nuclear chromatin showing DAPI (top), immunofluorescent staining against an endogenous histone modification (middle), and its corresponding EpiDamID construct visualized with m6A-Tracer (bottom). Left: H3K9ac, right: H3K9me3. Scale bar: 3 μm. |
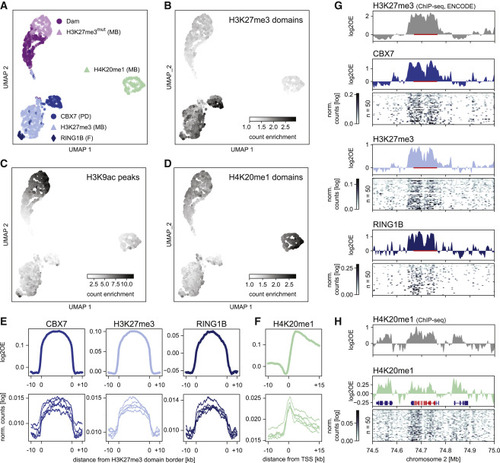
Figure 2. Detection of histone PTMs in single mouse embryonic stem cells with EpiDamID (A) UMAP based on the single-cell DamID readout of all single-cell samples. MB: mintbody; PD: protein domain; F: full protein. (B–D) DamID UMAP as in (A), colored by the enrichment of counts within H3K27me3 ChIP-seq domains (B), H3K9ac ChIP-seq peaks (C), and H4K20me1 ChIP-seq domains (D). (E) Average signal over H3K27me3 ChIP-seq domains of CBX7 and H3K27me3 targeting domains and full-length RINGB1B protein. (F) Average H4K20me1 signal over the TSS of the top 25% active genes (based on H3K9ac ChIP-seq signal). (E and F) Top: in silico populations normalized for Dam; Bottom: five of the best single-cell samples (bottom) normalized only by read depth. (G and H) Signal of various marks over the HoxD cluster and neighboring regions. ChIP-seq data is normalized for input control. DamID tracks show the Dam-normalized in silico populations of the various Dam-fusion proteins, DamID heatmaps show the depth-normalized single-cell data of the fifty richest cells. The HoxD cluster is indicated in red in (G) (bar) and (H) (RefSeq); additional RefSeq genes are shown (H). |
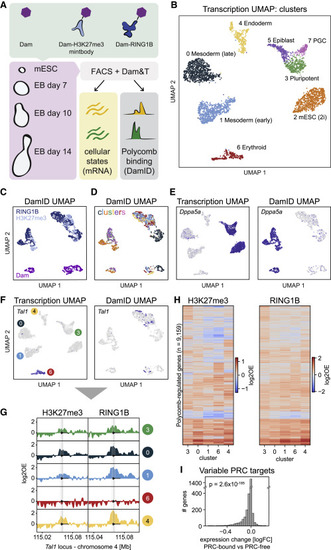
Figure 3. Joint profiling of Polycomb chromatin and gene expression in mouse embryoid bodies (A) Schematic showing the experimental design. (B) UMAP of samples based on transcriptional readout, colored by cluster. (C and D) UMAP of samples based on DamID readout, colored by construct (C) and cluster (D). (E) Transcriptomic UMAP (left) and DamID UMAP (right), colored by expression of pluripotency marker Dppa5a. (F) Transcriptomic UMAP (left) and DamID UMAP (right), colored by expression of hematopoietic regulator Tal1. (G) Genomic tracks of H3K27me3 and RING1B DamID signal per cluster at the Tal1 locus. (H) Heatmaps showing the H3K27me3 (left) and RING1B (right) DamID signal of all identified PRC targets for transcriptional clusters 3, 0, 1, 6, and 4. PRC targets are ordered based on hierarchical clustering. (I) Fold-change in expression of Polycomb targets between clusters where the gene is PRC-associated and clusters where the gene is PRC-free. The significance was tested with a two-sided Wilcoxon’s signed rank test (p = 2.6 × 10−185). |
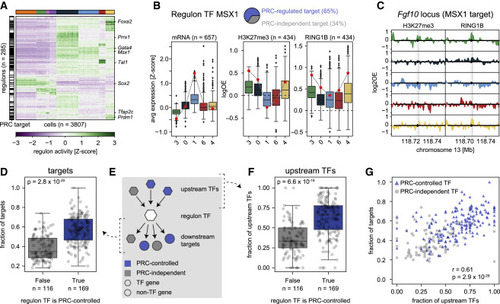
Figure 4. Polycomb-regulated transcription factors form separate regulatory networks (A) Heatmap showing SCENIC regulon activity per single cell. Cells (columns) are ordered by transcriptional cluster; regulon (rows) are ordered by hierarchical clustering. The black and white bar on the left indicates whether the regulon TF is a PRC target (black) or not (white). (B) Example of the relationship between expression and Polycomb regulation for the MSX1 regulon. Pie chart indicates the percentages of Polycomb-controlled (blue) or Polycomb-independent (gray) target genes. Left: boxplots showing target gene expression per cluster for all target genes. Middle and right: boxplots showing the H3K27me3 and RING1B DamID signal at the TSS per cluster for the Polycomb-controlled target genes. The expression and DamID signal of Msx1 is indicated with a red circle. (C) Genomic tracks of H3K27me3 and RING1B DamID signal per cluster at the Fgf10 locus, one of the target genes of MSX1. Arrow head indicates the location of the TSS; shaded area indicates −5kb/+3kb around the TSS. (D) Boxplots showing the fraction of Polycomb-controlled target genes, split by whether the TF itself is Polycomb-controlled. The significance was tested with a two-sided Mann-Whitney U test (p = 2.8 × 10⁻²⁰). Error bars indicate the data range within 1.5 times the inter-quartile range. (E) Schematic of the regulatory network, indicating the relationship between a regulon TF (white hexagon), its upstream regulators (colored hexagons), and its downstream targets (colored hexagons/circles). (F) Boxplots showing the fraction of Polycomb-controlled upstream regulators, split by whether the regulon TF is Polycomb-controlled. The significance was tested with a two-sided Mann-Whitney U test (p = 6.6 × 10⁻¹⁹). Error bars indicate the data range within 1.5 times the inter-quartile range. (G) Scatterplot showing the relationship between the fraction of Polycomb-controlled targets and regulators of a regulon TF. Regulon TFs that are PRC controlled are indicated in blue; regulon TFs that are PRC independent are indicated in gray. Correlation was computed using Pearson’s correlation (p = 2.9 × 10⁻²⁹). |
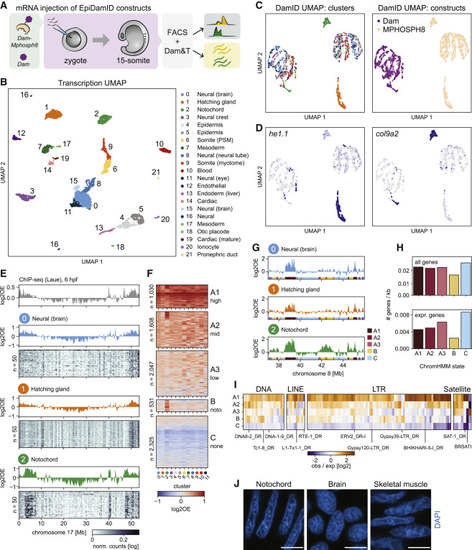
Figure 5. Notochord-specific H3K9me3 enrichment in the zebrafish embryo (A) Schematic representation of the experimental design and workflow. (B) UMAP based on the transcriptional readout of all single-cell samples passing CEL-Seq2 thresholds (n = 3902). (C) UMAP based on the genomic readout of all single-cell samples passing DamID thresholds (n = 2833). Samples are colored by transcriptional cluster (left) and Dam-targeting domain (right). (D) Expression of the hatching gland marker he1.1 (left) and the notochord marker col9a2 (right) projected onto the DamID UMAP. (E) Genomic H3K9me3 signal over chromosome 17. Top track: H3K9me3 ChIP-seq signal of 6-hpf embryo. Remaining tracks: combined single-cell Dam-MPHOSPH8 data for clusters 0–2. Heatmaps show the depth-normalized Dam-MPHOSPH8 data of the 50 richest cells. (F) Heatmap showing the cluster-specific average H3K9me3 enrichment over all domains called per ChromHMM state. Per state, domains were clustered using hierarchical clustering. (G) Genomic H3K9me3 signal over a part of chromosome 8 for clusters 0–2. The colored regions at the bottom of each track indicate the ChromHMM state. (H) Gene density of all genes (top) and expressed genes (bottom) per state. (I) Enrichment of repeats among the ChromHMM states. Example repeats are indicated. (J) Representative images of DAPI staining in cryosections of zebrafish embryos at 15-somite stage. Scale bars represent 4 μm. |