
Fig. 3
- ID
- ZDB-IMAGE-220526-29
- Publication
- Rang et al., 2022 - Single-cell profiling of transcriptome and histone modifications with EpiDamID
- All Figures
- Figures for Rang et al., 2022
|
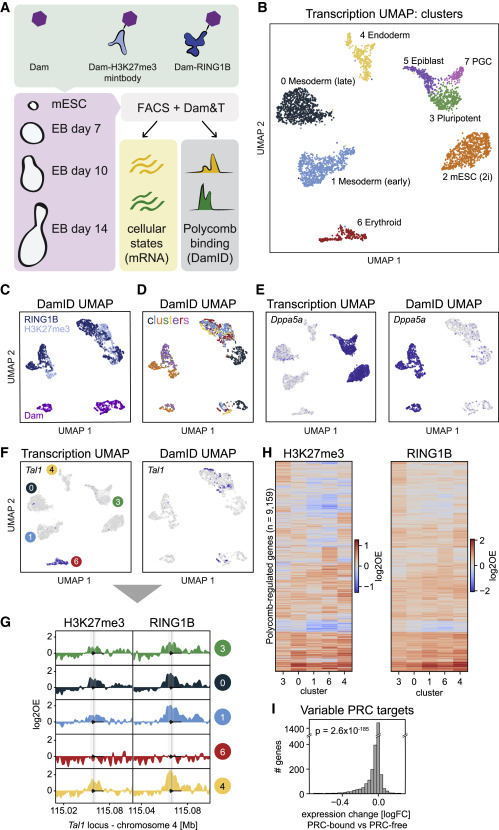
Fig. 3 Figure 3. Joint profiling of Polycomb chromatin and gene expression in mouse embryoid bodies (A) Schematic showing the experimental design. (B) UMAP of samples based on transcriptional readout, colored by cluster. (C and D) UMAP of samples based on DamID readout, colored by construct (C) and cluster (D). (E) Transcriptomic UMAP (left) and DamID UMAP (right), colored by expression of pluripotency marker Dppa5a. (F) Transcriptomic UMAP (left) and DamID UMAP (right), colored by expression of hematopoietic regulator Tal1. (G) Genomic tracks of H3K27me3 and RING1B DamID signal per cluster at the Tal1 locus. (H) Heatmaps showing the H3K27me3 (left) and RING1B (right) DamID signal of all identified PRC targets for transcriptional clusters 3, 0, 1, 6, and 4. PRC targets are ordered based on hierarchical clustering. (I) Fold-change in expression of Polycomb targets between clusters where the gene is PRC-associated and clusters where the gene is PRC-free. The significance was tested with a two-sided Wilcoxon’s signed rank test (p = 2.6 × 10−185).