
Fig. 2
- ID
- ZDB-FIG-220526-34
- Publication
- Rang et al., 2022 - Single-cell profiling of transcriptome and histone modifications with EpiDamID
- Other Figures
- All Figure Page
- Back to All Figure Page
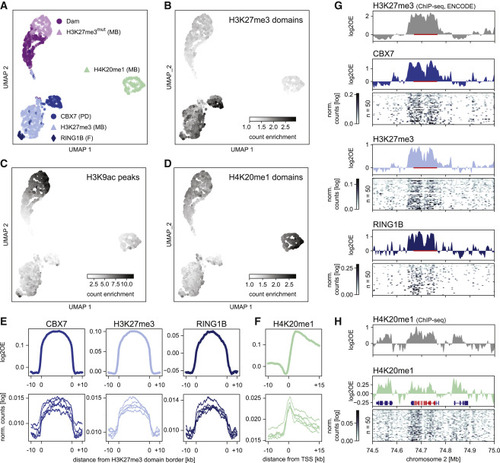
Figure 2. Detection of histone PTMs in single mouse embryonic stem cells with EpiDamID (A) UMAP based on the single-cell DamID readout of all single-cell samples. MB: mintbody; PD: protein domain; F: full protein. (B–D) DamID UMAP as in (A), colored by the enrichment of counts within H3K27me3 ChIP-seq domains (B), H3K9ac ChIP-seq peaks (C), and H4K20me1 ChIP-seq domains (D). (E) Average signal over H3K27me3 ChIP-seq domains of CBX7 and H3K27me3 targeting domains and full-length RINGB1B protein. (F) Average H4K20me1 signal over the TSS of the top 25% active genes (based on H3K9ac ChIP-seq signal). (E and F) Top: in silico populations normalized for Dam; Bottom: five of the best single-cell samples (bottom) normalized only by read depth. (G and H) Signal of various marks over the HoxD cluster and neighboring regions. ChIP-seq data is normalized for input control. DamID tracks show the Dam-normalized in silico populations of the various Dam-fusion proteins, DamID heatmaps show the depth-normalized single-cell data of the fifty richest cells. The HoxD cluster is indicated in red in (G) (bar) and (H) (RefSeq); additional RefSeq genes are shown (H). |