
Fig. 4
- ID
- ZDB-IMAGE-220526-30
- Publication
- Rang et al., 2022 - Single-cell profiling of transcriptome and histone modifications with EpiDamID
- All Figures
- Figures for Rang et al., 2022
|
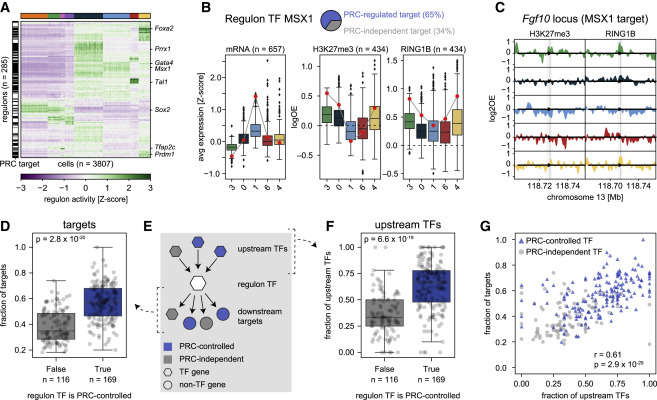
Fig. 4 Figure 4. Polycomb-regulated transcription factors form separate regulatory networks (A) Heatmap showing SCENIC regulon activity per single cell. Cells (columns) are ordered by transcriptional cluster; regulon (rows) are ordered by hierarchical clustering. The black and white bar on the left indicates whether the regulon TF is a PRC target (black) or not (white). (B) Example of the relationship between expression and Polycomb regulation for the MSX1 regulon. Pie chart indicates the percentages of Polycomb-controlled (blue) or Polycomb-independent (gray) target genes. Left: boxplots showing target gene expression per cluster for all target genes. Middle and right: boxplots showing the H3K27me3 and RING1B DamID signal at the TSS per cluster for the Polycomb-controlled target genes. The expression and DamID signal of Msx1 is indicated with a red circle. (C) Genomic tracks of H3K27me3 and RING1B DamID signal per cluster at the Fgf10 locus, one of the target genes of MSX1. Arrow head indicates the location of the TSS; shaded area indicates −5kb/+3kb around the TSS. (D) Boxplots showing the fraction of Polycomb-controlled target genes, split by whether the TF itself is Polycomb-controlled. The significance was tested with a two-sided Mann-Whitney U test (p = 2.8 × 10⁻²⁰). Error bars indicate the data range within 1.5 times the inter-quartile range. (E) Schematic of the regulatory network, indicating the relationship between a regulon TF (white hexagon), its upstream regulators (colored hexagons), and its downstream targets (colored hexagons/circles). (F) Boxplots showing the fraction of Polycomb-controlled upstream regulators, split by whether the regulon TF is Polycomb-controlled. The significance was tested with a two-sided Mann-Whitney U test (p = 6.6 × 10⁻¹⁹). Error bars indicate the data range within 1.5 times the inter-quartile range. (G) Scatterplot showing the relationship between the fraction of Polycomb-controlled targets and regulators of a regulon TF. Regulon TFs that are PRC controlled are indicated in blue; regulon TFs that are PRC independent are indicated in gray. Correlation was computed using Pearson’s correlation (p = 2.9 × 10⁻²⁹).