
Fig. 1
- ID
- ZDB-IMAGE-220526-27
- Publication
- Rang et al., 2022 - Single-cell profiling of transcriptome and histone modifications with EpiDamID
- All Figures
- Figures for Rang et al., 2022
|
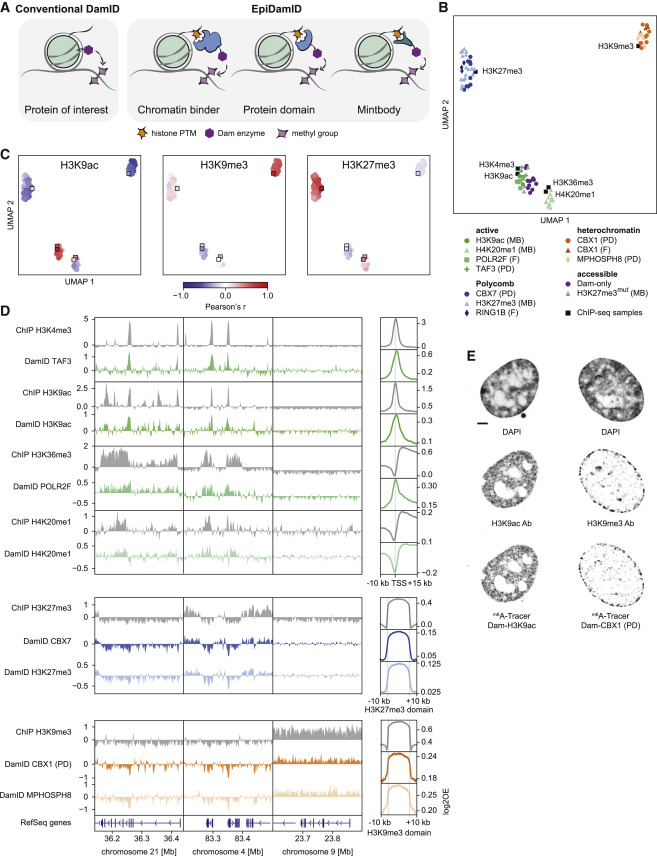
Fig. 1 Figure 1. Targeting domains specific to histone modifications mark distinct chromatin types with EpiDamID (A) Schematic overview of EpiDamID concept compared to conventional DamID. (B) UMAP of DamID samples colored by targeting construct, and ChIP-seq samples of corresponding histone modifications. MB: mintbody; PD: protein domain; F: full protein. (C) UMAPs as in (B), colored by correlation with selected ChIP-seq samples (H3K9ac, H3K9me3, and H3K27me3). Correlation values reflect the Pearson’s correlation coefficient of Dam-normalized samples with the indicated ChIP-seq sample. Control constructs (Dam, H3K27me3mut) are excluded from the UMAP. DamID samples are circles; ChIP-seq samples are squares. (D) Left: three genome browser views of ChIP-seq (gray) and DamID (colored) enrichment. Data represent the combined signal of all samples of each targeting domain. Right: average DamID and ChIP-seq enrichment plots over genomic regions of interest. Signal is normalized for untethered Dam or input, respectively. Regions are the TSS (−10/+15 kb) of the top 25% H3K9ac-enriched genes for the active marks (top), and ChIP-seq domains (−/+ 10 kb) for H3K27me3 (middle), and H3K9me3 (bottom). (E) Confocal images of nuclear chromatin showing DAPI (top), immunofluorescent staining against an endogenous histone modification (middle), and its corresponding EpiDamID construct visualized with m6A-Tracer (bottom). Left: H3K9ac, right: H3K9me3. Scale bar: 3 μm.