
- Title
-
Analysis of incidental findings in Qatar genome participants reveals novel functional variants in LMNA and DSP
- Authors
- Elfatih, A., Da'as, S.I., Abdelrahman, D., Mbarek, H., Mohammed, I., Hasan, W., Fakhro, K.A., Estivill, X., Mifsud, B., Qatar Genome Program Research Consortium
- Source
- Full text @ Hum. Mol. Genet.
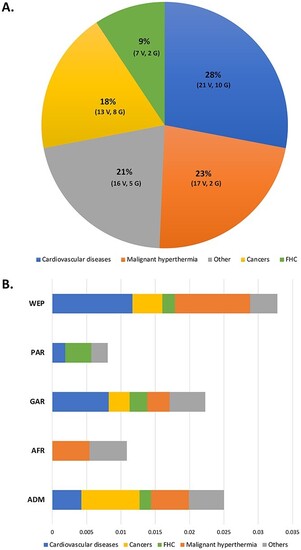
Distribution of ACMG novel variants among disease categories and QGP sub-population. ( |
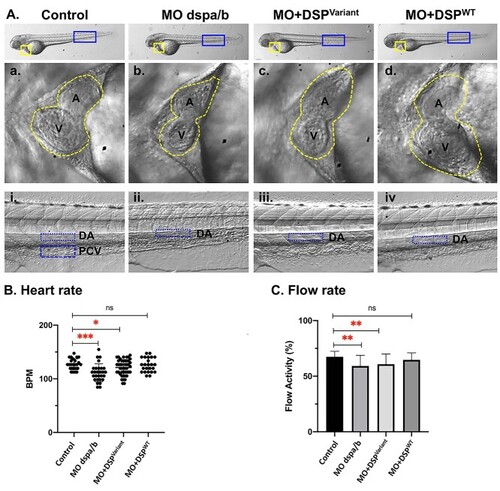
Zebrafish PHENOTYPE:
|

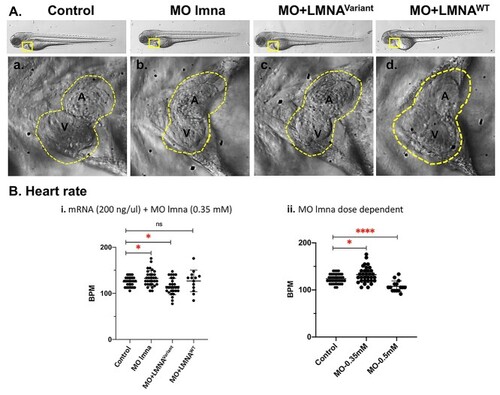
Zebrafish PHENOTYPE:
|
Zebrafish PHENOTYPE:
|
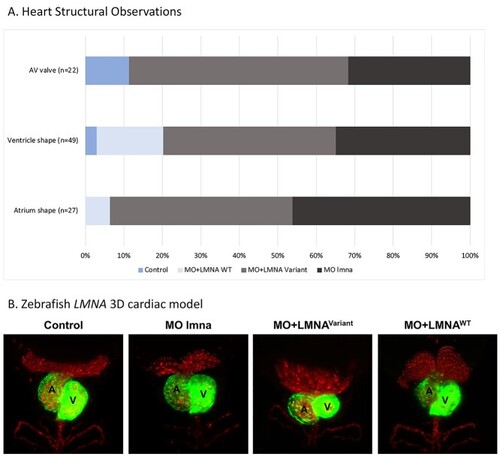
Zebrafish EXPRESSION / LABELING:
PHENOTYPE:
|