
- Title
-
Boosting targeted genome editing using the hei-tag
- Authors
- Thumberger, T., Tavhelidse-Suck, T., Gutierrez-Triana, J.A., Cornean, A., Medert, R., Welz, B., Freichel, M., Wittbrodt, J.
- Source
- Full text @ Elife
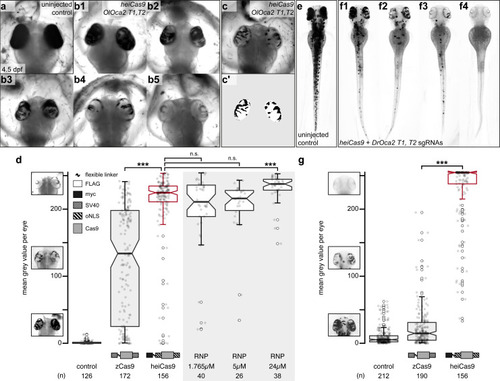
Phenotypic range and quantification of OlOca2 T1, T2, and DrOca2 T1, T2 sgRNAs/Cas9 variant and sgRNA/Cas9 protein complex (ribonucleoprotein [RNP])-mediated loss of pigmentation in medaka (a–d) and zebrafish (e–g) at high concentrations. (a) Fully pigmented eyes in uninjected control medaka embryo at 4.5 dpf. (b1–b5) Range of typically observed loss-of-pigmentation phenotypes upon injection with 150ng/µl heiCas9 mRNA and 30ng/µl OlOca2 T1, T2 sgRNAs. The observed phenotypes range from almost full pigmentation (b1) to completely unpigmented eyes (b5). (c) Minimum intensity projection of a medaka embryo at 4.5days after injection with 150ng/µl heiCas9 and 30ng/µl OlOca2 T1, T2 sgRNAs. (c’) Locally thresholded pigmentation on elliptical selection per eye (same embryo as in c). (d) Quantification of mean gray values (0 = fully pigmented, 255 = completely unpigmented) of individual eyes from Oca2 knock-out medaka crispants co-injected with 30ng/µl OlOca2 T1, T2 sgRNAs and 150ng/µl mRNAs of zCas9 and heiCas9 (red) compared to RNP injections (concentrations indicated). Medians: uninjected control = 0.4; zCas9 = 134.5; heiCas9 = 225.3; 1.765µM RNP = 211.1; 5µM RNP = 216.2; 24µM RNP = 237.8. Note: highly significant pigment loss (70% increase) in heiCas9 vs. zCas9 crispants (p = 1.1e-25); heiCas9 reaches the same knock-out efficiency compared to RNP injections with only significant differences at highest RNP concentrations (24µM). (e) Fully pigmented uninjected control zebrafish embryo at 2.5 dpf. (f1–f4) Range of typically observed loss-of-pigmentation phenotypes upon injection with 150ng/µl heiCas9 mRNA and 30ng/µl DrOca2 T1, T2 sgRNAs. The observed phenotypes range from almost full pigmentation (f1) to completely unpigmented eyes and body (f4). (g) Quantification of mean gray values of individual eyes from oca2 knock-out zebrafish embryos co-injected with 30ng/µl DrOca2 T1, T2 sgRNAs and 150ng/µl mRNAs of zCas9 and heiCas9 (red), respectively. Medians: uninjected control = 5.3; zCas9 = 14.7; heiCas9 = 254.6. Note the very highly significant pigment loss (17-fold increase) in heiCas9 vs. zCas9 crispants (p = 2.1e-56). dpf, days post fertilization; mean gray values ranged from 0, that is, fully pigmented eye to 255, that is, complete loss of pigmentation; n, number of eyes analyzed. Bold line, median. Statistical analysis performed in R, pairwise Wilcoxon rank sum test, Bonferroni corrected.
|
Comparison of |
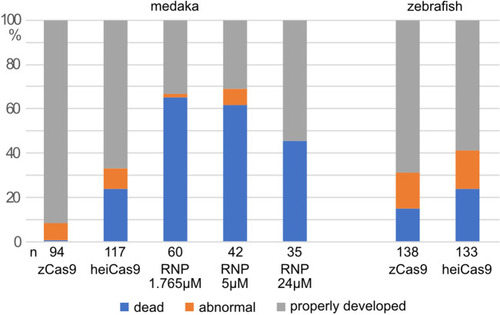
Percentage of dead, abnormal (e.g. delayed development or malformation), and properly developed injected embryos. Only properly developed embryos were included for analysis. n, total number of injected embryos. |
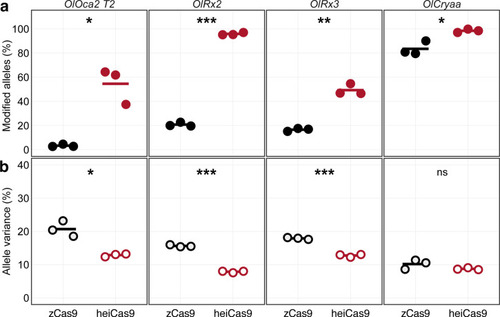
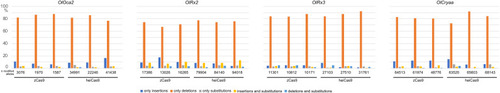
Multiplexed injections with 15ng/µl mRNA of zCas9 or heiCas9 (red) mRNA and 12.5ng/µl per sgRNA targeting exonic sequences in oculocutaneous albinism type 2 (oca2; OlOca2 T2), the start codons of the retina-specific homeobox transcription factor 2 (rx2; OlRx2) and of the alpha a crystallin (cryaa; OlCryaa), as well as an intronic sequence in rx3 (OlRx3). Illumina sequencing performed on three biological replicates (eight embryos each) per targeted locus. (a) Increased knock-out efficiency in heiCas9 crispants as shown by proportion of modified over all Illumina sequencing reads per replicate and locus. (b) Reduced allele variance in heiCas9 crispants as shown by abundance of specific allele divided by all modified alleles per replicate and locus. Bold line, mean values of zCas9 (black) and heiCas9 (red). Total aligned Illumina reads analyzed: OlOca2: zCas9 = 194,931, heiCas9 = 180,222; OlRx2: zCas9 = 224,146, heiCas9 = 269,103; OlRx3: zCas9 = 195,248, heiCas9 = 175,044; OlCryaa: zCas9 = 209,573, heiCas9 = 200,448. Statistical analysis performed in R, Student’s t-test.
|
Relative abundance of Illumina reads categorized by mode of editing among all modified alleles per replicate, locus ( |
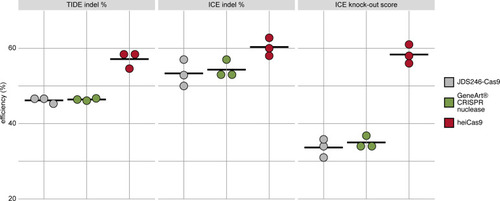
Mouse SW10 cells were co-transfected with MmPrx crRNA and mRNAs of JDS246-Cas9, GeneArt CRISPR nuclease, and heiCas9, respectively. Genome editing efficiency was assessed by Tracking of Indels by Decomposition (TIDE) and Inference of CRISPR Editing (ICE) tools. ICE knock-out score represents proportion of indels that indicate a frameshift or≥21bp deletion. Data points represent three biological replicates, black line indicates respective mean: TIDE indel %: JDS246-Cas9 = 46.2; GeneArt CRISPR nuclease = 46.4, heiCas9 = 57.1; ICE indel %: JDS246-Cas9 = 53.3; GeneArt CRISPR nuclease = 54.3, heiCas9 = 60.3; ICE knock-out score %: JDS246-Cas9 = 33.7; GeneArt CRISPR nuclease = 35.0, heiCas9 = 58.3. R2> 0.9 (TIDE) and>0.9 (ICE) for all mRNAs tested. For representative indel spectrum for each mRNA, see Figure 3—figure supplement 1.
|
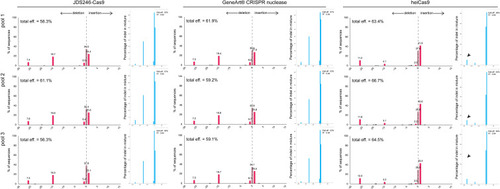
Indel spectrum diagram obtained from Tracking of Indels by Decomposition (TIDE) (red bargraphs) and Inference of CRISPR Editing (ICE) (blue bargraphs) analyses following |
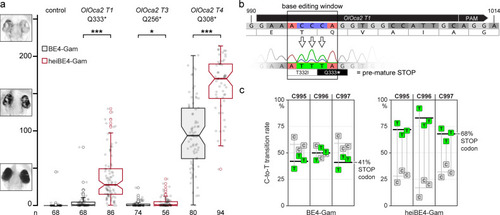
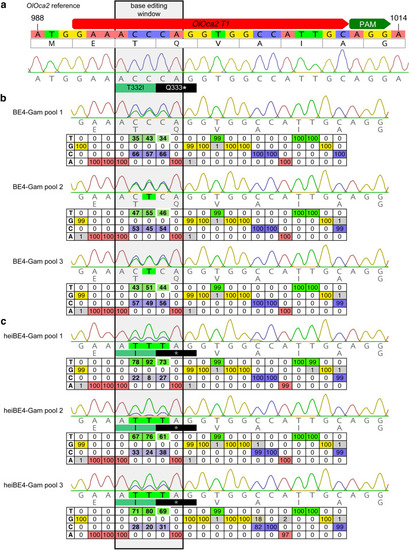
Phenotypic range and quantification of heiBE4-Gam-mediated C-to-T transitions in medaka embryos. (a) Categories of typically observed loss-of-pigmentation phenotypes in oca2 editants. The observed pigmentation phenotypes range from (almost) unpigmented eyes, that is, a very strong knock-out (top panel) over intermediate (central panel) to no loss of pigmentation (bottom panel). Quantification of phenotype resulting from injections with either BE4-Gam or heiBE4-Gam (red) mRNA and OlOca2 T1, T3, or T4 sgRNAs. Note: dramatic increase of bi-allelic knock-out rate when using heiBE4-Gam. n, number of eyes analyzed. Control median = 0.0; medians BE4-Gam vs. heiBE4-Gam: OlOca2 T1, 0.6 vs. 28.0, p = 1.737; OlOca2 T3, 0.0 vs. 0.8, p = 0.0471; OlOca2 T4, 93.8 vs. 170.1, p = 5.215e-12. Bold lines, median values. Statistical analysis performed in R, pairwise Wilcoxon rank sum test. (b) Schematic representation of base editing window in OlOca2 T1 target site (PAM, protospacer adjacent motif). C-to-T transition of C995 and C996 edits the threonine (T) codon to isoleucine (I) (T332I); C997T creates a pre-mature STOP codon (Q333*). Nucleotide positions refer to the oca2 open reading frame. (c) Quantification of Sanger sequencing reads at nucleotides C995, C996, C997 inside the base editing window of three injected embryo pools (five embryos each) reveals overall dramatic increase of C-to-T base transition when using heiBE4-Gam. Note 1.7-fold increase of C997T transition, that is, efficient introduction of a pre-mature STOP codon. Mean values indicated by bold horizontal lines, Figure 4—figure supplement 1.
|
( |