
IMAGE
Figure 3—figure supplement 1.
- ID
- ZDB-IMAGE-220507-26
- Source
- Figures for Thumberger et al., 2022
Image
|
Figure Caption
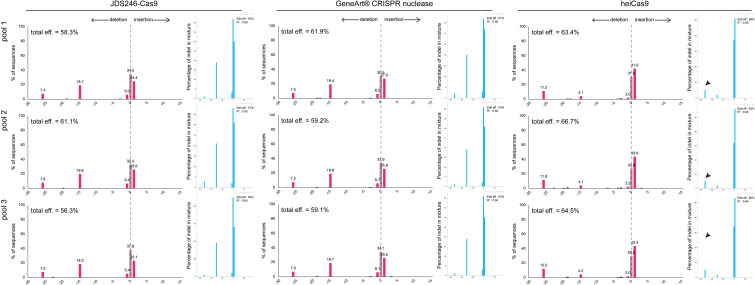
Figure 3—figure supplement 1.
Indel spectrum diagram obtained from Tracking of Indels by Decomposition (TIDE) (red bargraphs) and Inference of CRISPR Editing (ICE) (blue bargraphs) analyses following
Acknowledgments
This image is the copyrighted work of the attributed author or publisher, and
ZFIN has permission only to display this image to its users.
Additional permissions should be obtained from the applicable author or publisher of the image.
Full text @ Elife