
Figure 1
- ID
- ZDB-FIG-220507-22
- Publication
- Thumberger et al., 2022 - Boosting targeted genome editing using the hei-tag
- Other Figures
- All Figure Page
- Back to All Figure Page
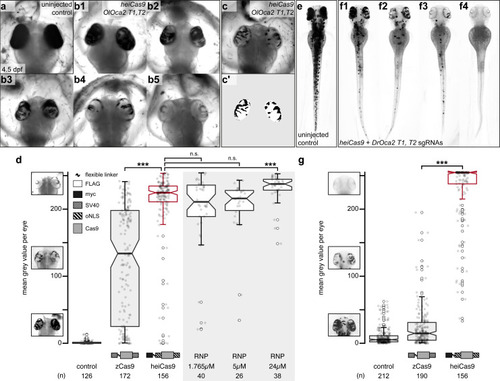
Phenotypic range and quantification of OlOca2 T1, T2, and DrOca2 T1, T2 sgRNAs/Cas9 variant and sgRNA/Cas9 protein complex (ribonucleoprotein [RNP])-mediated loss of pigmentation in medaka (a–d) and zebrafish (e–g) at high concentrations. (a) Fully pigmented eyes in uninjected control medaka embryo at 4.5 dpf. (b1–b5) Range of typically observed loss-of-pigmentation phenotypes upon injection with 150ng/µl heiCas9 mRNA and 30ng/µl OlOca2 T1, T2 sgRNAs. The observed phenotypes range from almost full pigmentation (b1) to completely unpigmented eyes (b5). (c) Minimum intensity projection of a medaka embryo at 4.5days after injection with 150ng/µl heiCas9 and 30ng/µl OlOca2 T1, T2 sgRNAs. (c’) Locally thresholded pigmentation on elliptical selection per eye (same embryo as in c). (d) Quantification of mean gray values (0 = fully pigmented, 255 = completely unpigmented) of individual eyes from Oca2 knock-out medaka crispants co-injected with 30ng/µl OlOca2 T1, T2 sgRNAs and 150ng/µl mRNAs of zCas9 and heiCas9 (red) compared to RNP injections (concentrations indicated). Medians: uninjected control = 0.4; zCas9 = 134.5; heiCas9 = 225.3; 1.765µM RNP = 211.1; 5µM RNP = 216.2; 24µM RNP = 237.8. Note: highly significant pigment loss (70% increase) in heiCas9 vs. zCas9 crispants (p = 1.1e-25); heiCas9 reaches the same knock-out efficiency compared to RNP injections with only significant differences at highest RNP concentrations (24µM). (e) Fully pigmented uninjected control zebrafish embryo at 2.5 dpf. (f1–f4) Range of typically observed loss-of-pigmentation phenotypes upon injection with 150ng/µl heiCas9 mRNA and 30ng/µl DrOca2 T1, T2 sgRNAs. The observed phenotypes range from almost full pigmentation (f1) to completely unpigmented eyes and body (f4). (g) Quantification of mean gray values of individual eyes from oca2 knock-out zebrafish embryos co-injected with 30ng/µl DrOca2 T1, T2 sgRNAs and 150ng/µl mRNAs of zCas9 and heiCas9 (red), respectively. Medians: uninjected control = 5.3; zCas9 = 14.7; heiCas9 = 254.6. Note the very highly significant pigment loss (17-fold increase) in heiCas9 vs. zCas9 crispants (p = 2.1e-56). dpf, days post fertilization; mean gray values ranged from 0, that is, fully pigmented eye to 255, that is, complete loss of pigmentation; n, number of eyes analyzed. Bold line, median. Statistical analysis performed in R, pairwise Wilcoxon rank sum test, Bonferroni corrected.
|