FIGURE SUMMARY
Title

Starvation causes changes in the intestinal transcriptome and microbiome that are reversed upon refeeding

Authors
Jawahar, J., McCumber, A.W., Lickwar, C.R., Amoroso, C.R., de la Torre Canny, S.G., Wong, S., Morash, M., Thierer, J.H., Farber, S.A., Bohannan, B.J.M., Guillemin, K., Rawls, J.F.
Source
Full text @ BMC Genomics

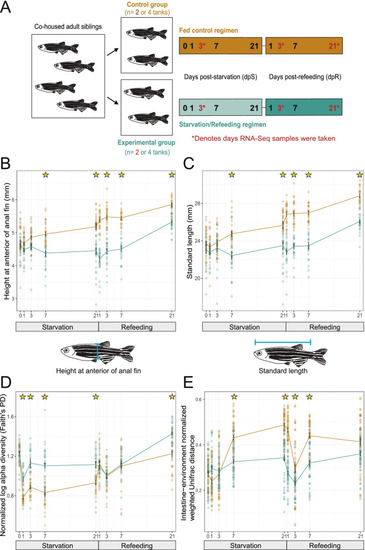
Starvation and refeeding affect zebrafish somatic growth as well as intestinal and environmental microbiome diversity. A Study design schematic. Cohoused adult siblings were divided into either control (fed) or experimental (starved) tanks. Samples were then taken from each tank on days 0, 1, 3, 7 and 21 post-starvation (dpS) as well as 1, 3, 7, and 21 days post-refeeding (dpR) for 16S rRNA gene sequencing. RNA-seq samples were taken at 3 dpS, 21 dpS, and 3 dpR. B Fed and starved zebrafish height at anterior of anal fin (HAA) in mm at corresponding timepoints. C Standard length in mm of starved and fed zebrafish. D Faith’s PD alpha diversity for fed and control zebrafish. Values are log transformed and normalized by the scores at day 0. E Weighted UniFrac distance between the gut and associated environment sample. Stars in panels B-E denote significant difference (p < 0.05 by Tukey’s HSD test)

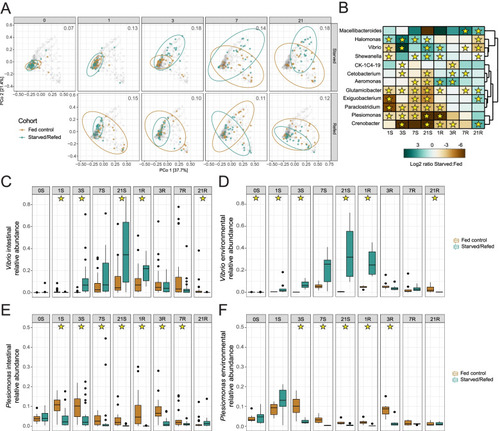
Starvation and refeeding dynamically alters composition of the adult zebrafish intestinal microbiome. A Principal coordinates analysis of weighted UniFrac diversity for fed and starved zebrafish. The distance between centroids of the two cohorts at the corresponding timepoint is shown in the top right of each plot. The gray dots represent every sample in the study, while the samples from a given timepoint are labeled in their respective panel according to their cohort (green: starved/refed, gold: fed controls). B Heatmap of log2 ratio of the relative abundance of bacterial genera between starved and fed controls. Stars denote day identified as significant by LEfSe. C Relative abundance of Vibrio in starved and control zebrafish intestines by day. D Relative abundance of Vibrio in starved and control environmental tank water samples by day. E Relative abundance of Plesiomonas in starved and control zebrafish intestines by day. F Relative abundance of Plesiomonas in starved and control environmental tank water samples by day. Stars in panels C-F denote significance (p < 0.05) by pairwise Wilcoxon test with BH correction

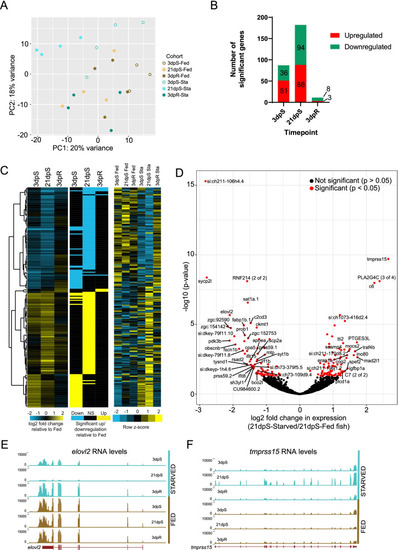
Starved zebrafish differentially regulate intestinal gene expression when compared to fed zebrafish. A Principal Components Analysis (PCA) of RNA-Seq libraries in starved/refed and fed control zebrafish intestines at 3dpS, 21dpS, and 3dpR. B Quantification of the number of significantly upregulated and downregulated genes in starved/refed zebrafish intestines at each timepoint. Note that these numbers in panel B include genes that were also significantly differential in our fed control comparisons. C Hierarchical clustering of log2 fold changes in gene expression in starved zebrafish intestines, along with flattened values that show significant changes in gene expression, and z-scores based on normalized counts of each gene. D Log2 fold changes in gene expression in starved zebrafish intestines at 21dpS when compared to 21dpS fed fish plotted according to their -log10 adjusted p-values. Note that data plotted in panels C and D do not include genes that were significantly differential within fed fish (see Table S3B and Fig. S2). E UCSC tracks of representative replicates show that elovl2 mRNA, encoding a fatty acid elongase, is downregulated in starved zebrafish intestines and returns to levels comparable to the fed group upon re-feeding. F UCSC tracks of representative replicates show that tmprss15 mRNA, encoding an enteropeptidase, is upregulated in starved zebrafish intestines and returns to levels comparable to the fed group upon re-feeding

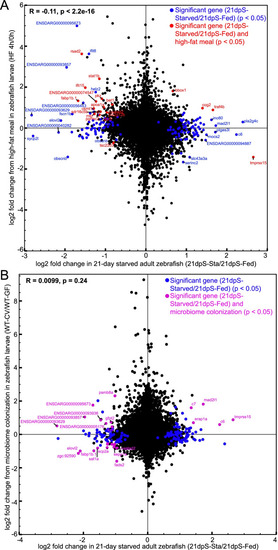
Some genes responsive to starvation in the intestine are also responsive to high fat feeding and microbial colonization. A Log2 fold changes for genes from 21dpS (X-axis) plotted according to their log2 fold changes in egg yolk-fed larval zebrafish compared to unfed controls (Y-axis), described in Zeituni et al [59]. Significantly differential genes only in starved zebrafish are plotted in blue, whereas genes significant in both datasets are plotted in red. Pearson’s correlation revealed a significant correlation between the two datasets (p < 0.05). B Log2 fold changes for genes from 21dpS (X-axis) plotted according to their log2 fold changes in zebrafish larvae colonized with a microbiome compared to germ-free controls (Y-axis), described in Davison et al [74]. Genes with significant log2 fold changes only in starved zebrafish are plotted in blue, whereas genes significant in both datasets are plotted in magenta. Pearson’s correlation did not reveal a significant correlation between the two datasets (p > 0.05)

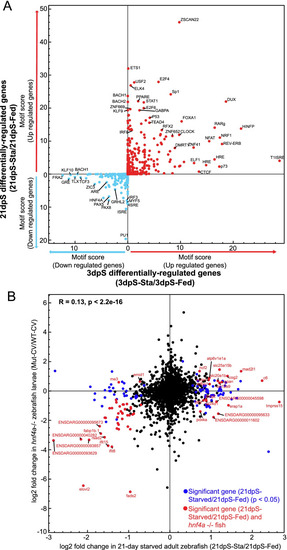
The transcription factor hnf4a may regulate a subset of genes involved in starvation. A Scatterplot for motif enrichment scores for genes that were significantly up- or down-regulated at 3dpS (X-axis) and 21dpS (Y-axis), according to HOMER analysis of transcription factor binding sites within 10 KB upstream or downstream of the genes’ transcription start sites at each time point, based on whether these sites were located within accessible chromatic regions. The motif score reflects the log10 p-value assigned by HOMER to each motif, comparing genes up- or down-regulated at the specified timepoint using as background the genes that were regulated in the opposite direction at the same timepoint. HNF4A is among the transcription factors whose binding sites are enriched at genes downregulated at both 3dpS and 21dpS. B Log2 fold changes for genes from 21dpS (X-axis) plotted according to their log2 fold changes in digestive tracts dissected from hnf4a mutant zebrafish larvae compared to wild-type controls (Mut-CV/WT-CV) (Y-axis), described in Davison et al [74]. Genes with genes with significant differential gene expression (21dpsSta/Fed) changes only in starved zebrafish are plotted in blue, whereas genes significant in both datasets are plotted in red. Pearson’s correlation revealed a significant correlation between the two datasets (p < 0.05)

Acknowledgments
This image is the copyrighted work of the attributed author or publisher, and ZFIN has permission only to display this image to its users. Additional permissions should be obtained from the applicable author or publisher of the image. Full text @ BMC Genomics