IMAGE

Fig. 1

ID
ZDB-IMAGE-220327-12
Source
Figures for Jawahar et al., 2022
Image
Figure Caption

Fig. 1

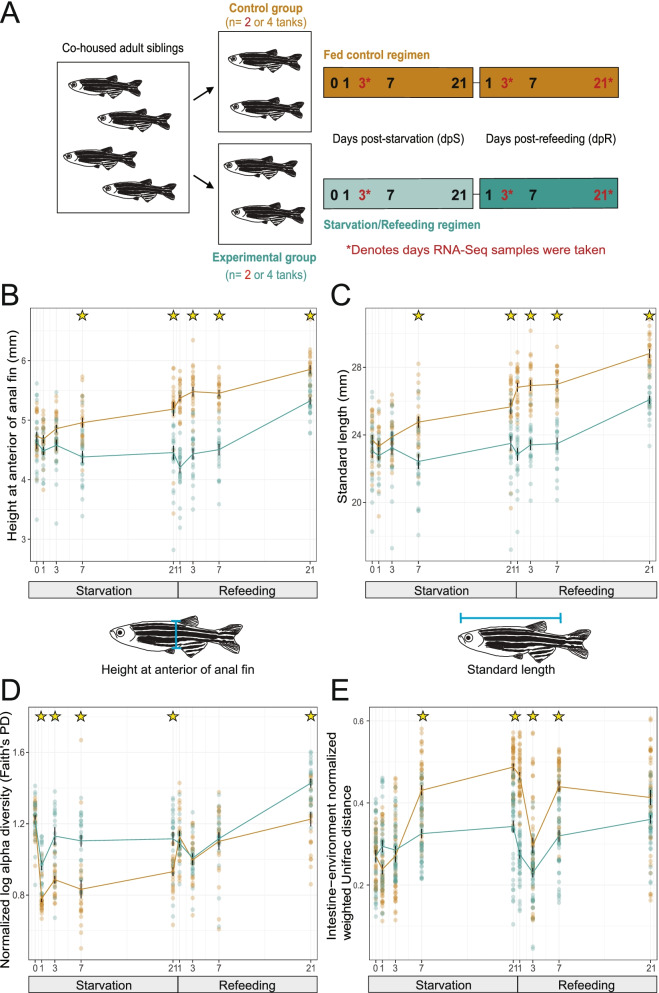
Starvation and refeeding affect zebrafish somatic growth as well as intestinal and environmental microbiome diversity. A Study design schematic. Cohoused adult siblings were divided into either control (fed) or experimental (starved) tanks. Samples were then taken from each tank on days 0, 1, 3, 7 and 21 post-starvation (dpS) as well as 1, 3, 7, and 21 days post-refeeding (dpR) for 16S rRNA gene sequencing. RNA-seq samples were taken at 3 dpS, 21 dpS, and 3 dpR. B Fed and starved zebrafish height at anterior of anal fin (HAA) in mm at corresponding timepoints. C Standard length in mm of starved and fed zebrafish. D Faith’s PD alpha diversity for fed and control zebrafish. Values are log transformed and normalized by the scores at day 0. E Weighted UniFrac distance between the gut and associated environment sample. Stars in panels B-E denote significant difference (p < 0.05 by Tukey’s HSD test)

Acknowledgments
This image is the copyrighted work of the attributed author or publisher, and ZFIN has permission only to display this image to its users. Additional permissions should be obtained from the applicable author or publisher of the image. Full text @ BMC Genomics