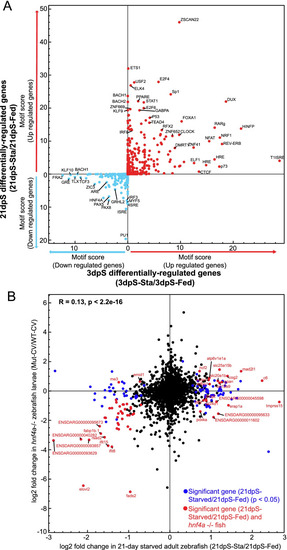
The transcription factor hnf4a may regulate a subset of genes involved in starvation. A Scatterplot for motif enrichment scores for genes that were significantly up- or down-regulated at 3dpS (X-axis) and 21dpS (Y-axis), according to HOMER analysis of transcription factor binding sites within 10 KB upstream or downstream of the genes’ transcription start sites at each time point, based on whether these sites were located within accessible chromatic regions. The motif score reflects the log10 p-value assigned by HOMER to each motif, comparing genes up- or down-regulated at the specified timepoint using as background the genes that were regulated in the opposite direction at the same timepoint. HNF4A is among the transcription factors whose binding sites are enriched at genes downregulated at both 3dpS and 21dpS. B Log2 fold changes for genes from 21dpS (X-axis) plotted according to their log2 fold changes in digestive tracts dissected from hnf4a mutant zebrafish larvae compared to wild-type controls (Mut-CV/WT-CV) (Y-axis), described in Davison et al [74]. Genes with genes with significant differential gene expression (21dpsSta/Fed) changes only in starved zebrafish are plotted in blue, whereas genes significant in both datasets are plotted in red. Pearson’s correlation revealed a significant correlation between the two datasets (p < 0.05)
|
