IMAGE

Fig. 2

ID
ZDB-IMAGE-220327-13
Source
Figures for Jawahar et al., 2022
Image
Figure Caption

Fig. 2

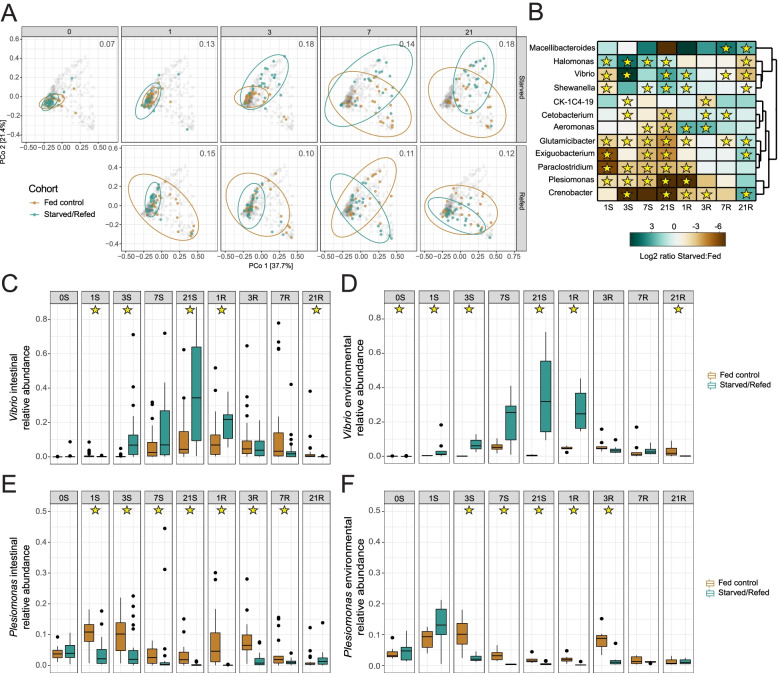
Starvation and refeeding dynamically alters composition of the adult zebrafish intestinal microbiome. A Principal coordinates analysis of weighted UniFrac diversity for fed and starved zebrafish. The distance between centroids of the two cohorts at the corresponding timepoint is shown in the top right of each plot. The gray dots represent every sample in the study, while the samples from a given timepoint are labeled in their respective panel according to their cohort (green: starved/refed, gold: fed controls). B Heatmap of log2 ratio of the relative abundance of bacterial genera between starved and fed controls. Stars denote day identified as significant by LEfSe. C Relative abundance of Vibrio in starved and control zebrafish intestines by day. D Relative abundance of Vibrio in starved and control environmental tank water samples by day. E Relative abundance of Plesiomonas in starved and control zebrafish intestines by day. F Relative abundance of Plesiomonas in starved and control environmental tank water samples by day. Stars in panels C-F denote significance (p < 0.05) by pairwise Wilcoxon test with BH correction

Acknowledgments
This image is the copyrighted work of the attributed author or publisher, and ZFIN has permission only to display this image to its users. Additional permissions should be obtained from the applicable author or publisher of the image. Full text @ BMC Genomics