
- Title
-
Rora Regulates Neutrophil Migration and Activation in Zebrafish
- Authors
- Hsu, A.Y., Wang, T., Syahirah, R., Liu, S., Li, K., Zhang, W., Wang, J., Cao, Z., Tian, S., Matosevic, S., Staiger, C.J., Wan, J., Deng, Q.
- Source
- Full text @ Front Immunol
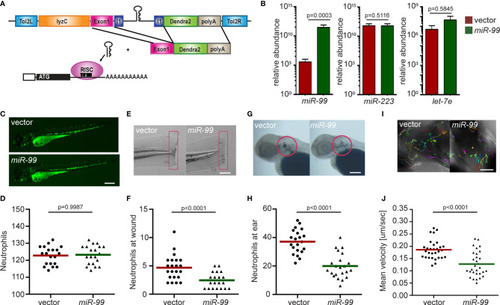
Neutrophil-specific |

MIR-99 overexpression inhibits chemotaxis of dHL-60 cells. |

|

Pharmacological inhibition of Rora reduces neutrophil motility and chemotaxis in zebrafish and humans. |

Dominant-negative Rorα suppresses neutrophil motility and chemotaxis. |

Rorα in neutrophils protects zebrafish against |
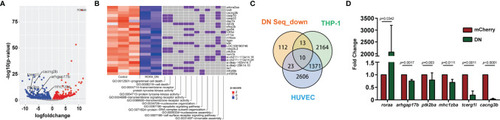
RNA-Seq reveals the direction of |