IMAGE

Figure 2

ID
ZDB-IMAGE-220324-6
Source
Figures for Hsu et al., 2022
Image
Figure Caption

Figure 2

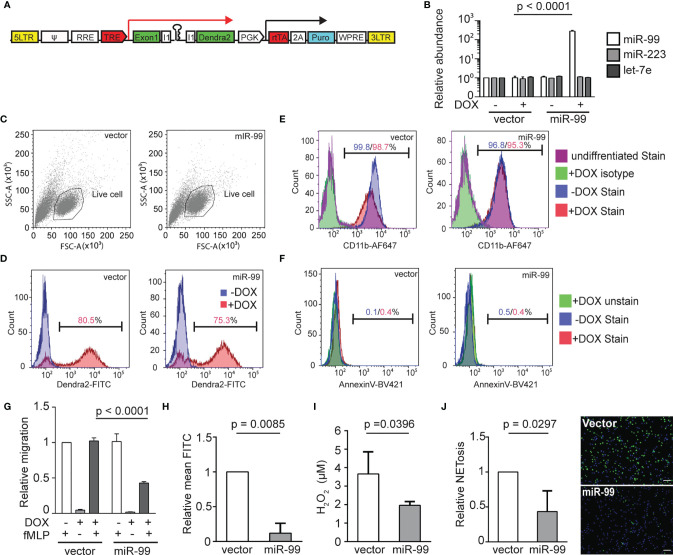
MIR-99 overexpression inhibits chemotaxis of dHL-60 cells. (A) Construct for inducible miRNA expression. The miRNA and a dendra2 reporter (green) are controlled by TRE, Tetracyclin response element (red). The PGK promoter drives constitutive expression of puromycin resistance gene (cyan) and the rtTA, reverse tetracycline-controlled transactivator (red). (B) Quantification of MIR-99, MIR-233, and LET-7E in dHL-60 cell lines with/without induced expression of the vector control or MIR-99. The result from three independent experiments is normalized to U6 expression levels and presented as mean ± s.d., students’ t-test. (C) Cell populations gated for downstream cell profile analysis and transwell quantification. (D) Doxycycline-mediated induction in the vector or miR-99 expressing dHL-60 lines. Cells without doxycycline-mediated induction were used as a baseline. Percentage of cells with dendra2 levels above the baseline are shown. (E) Surface CD11b levels in vector or miR-99 expressing dHL-60 cells. Undifferentiated cells or differentiated cells stained with an isotype control were used as a baseline. Percentage of cells with CD11b levels above the baseline with or without doxycycline-mediated induction are shown. (F) Annexin V staining in the total cell population (excluding debris) of vector or miR-99 expressing dHL-60 cells. An unstained live sample is used to determine the baseline. Percentage of cells with AnnexinV levels above the baseline with or without doxycycline-mediated induction are shown. (C–F) One representative experiment of three independent trials is shown. (G–J) (G) Transwell migration of dHL-60 cells with/without induced expression of the vector control or MIR-99 toward fMLP, (H) phagocytosis of BioParticles by dHL60 cells represented as mean FITC, (I) H2O2 concentration in PMA-induced dHL60 cells, and (J) Quantification of dHL60 undergoing NETosis (left) and representative images (right). Scale bar, 100µm. Results are presented as mean ± s.d., from three independent experiments and normalized to vector, Kruskal–Wallis test or Mann-Whitney test.

Acknowledgments
This image is the copyrighted work of the attributed author or publisher, and ZFIN has permission only to display this image to its users. Additional permissions should be obtained from the applicable author or publisher of the image. Full text @ Front Immunol