FIGURE SUMMARY
Title

Müller Glia maintain their regenerative potential despite degeneration in the aged zebrafish retina

Authors
Martins, R.R., Zamzam, M., Tracey-White, D., Moosajee, M., Thummel, R., Henriques, C.M., MacDonald, R.B.
Source
Full text @ Aging Cell

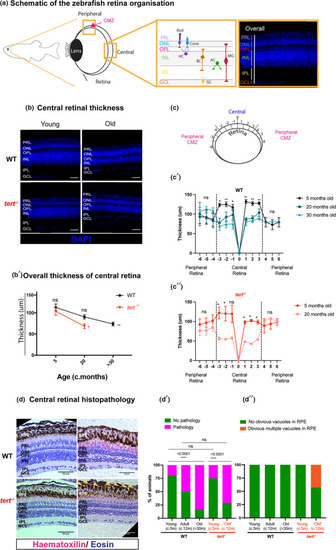
Zebrafish retina ageing is characterised by tissue thinning and morphological alterations, independently of telomerase. (a) Schematic figure of the zebrafish retina highlighting the peripheral, including the proliferative ciliary marginal zone (CMZ), and central retina, with respective layers and cell types (inset). (b) Central retina stained with DAPI in both WT and tert−/−, at young (5 months) and old ages (>30 months in WT and c. 20 months in tert−/−). Scale bars: 20 μm. (b’) Quantifications of retina thickness by DAPI staining. N = 3 per group. Error bars represent the standard error of the mean (SEM). (c) Schematic figure of the retina showing the twelve regions where retina thickness was quantified (6 central and 6 peripheral regions). (c’) Spider plots showing the thickness across the WT retina at 5 months, 20 months and 30 months. (c’’) Spider plots showing the thickness across the tert−/− retina at 5 and 20 months. (d) H&E staining in both WT and tert−/−, at young (c. 5 months) and old ages (>30 months in WT and c. 12 months in tert−/−). Scale bars: 50 μm. (d’–d’’) Qualitative assessment of H&E staining in the retina, (d’) considering overall pathology signs and (d’’) the presence of vacuoles in the RPE layer. N = 4–7 per group. GCL, ganglion cell layer; IPL, inner plexiform layer; INL, inner nuclear layer; OPL, outer plexiform layer; ONL, outer nuclear layer; PRL, photoreceptor layer. p‐value: *<0.05; **<0.01; ***<0.001

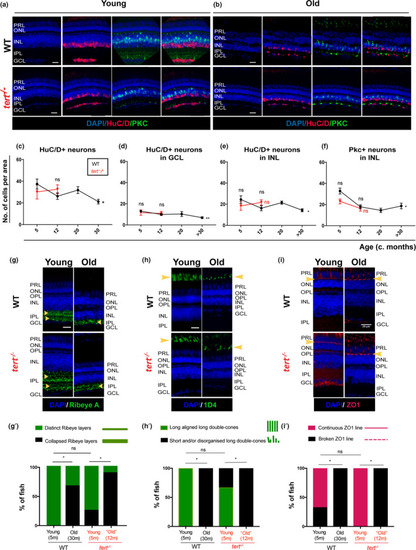
Zebrafish retina undergoes neurodegeneration with ageing, independently of telomerase. The central retina immunolabelled with HuC/D and PKC (amacrine in magenta and bipolar cells in green, respectively), in both WT and tert−/−, in (a) young (5 months) and (b) old adults (>30 months in WT and 12 months in tert−/−). Scale bars: 20 μm. (c–f) Quantifications of the number of HuC/D‐positive neurons per area (10,000 μm2) (c) in the overall retina, and (d) in the GCL (ganglion cells) and (e) INL (amacrine cells). (f) Quantifications of the number of PKC‐positive neurons cells per area (10,000 μm2) in the INL (bipolar cells). Error bars represent the SEM. N = 3–7. (g–i) The central retina immunolabelled with (g) Ribeye A (BC synaptic terminals, in green), (h) 1D4 (outer segments of long double‐cones, in green), and (i) ZO1 (outer limiting membrane, in red), in both WT and tert−/−, in young (5 months) and old adults (>30 months in WT and 12 months in tert−/−). Scale bars: 20 μm. (g’–i’) Quantification of the percentage of fish presenting defects in (g’) Ribeye A (phenotype observed as disorganised synaptic terminal layering in the IPL), (h’) 1D4 (short and/or misaligned long double‐cone outer segments), and (i’) ZO1 (broken outer limiting membrane). Error bars represent the SEM. (g’) N = 4–9, (h’, i’) N = 3–6

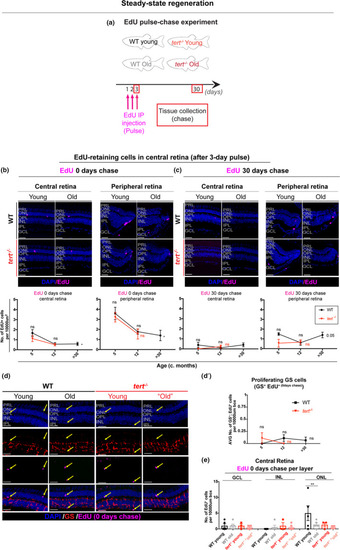
Aged zebrafish retina does not show signs of regeneration in response to spontaneous cell death and neuronal loss. (a) Schematic figure of the experimental design: 3‐day pulse of EdU, by IP injection, followed by 0‐ or 30‐day chase. We anticipate that in a healthy young fish the retina has some cells proliferating in the CMZ, which over‐time will replace older cells in the central retina. In the case of injury, we anticipate that there will be elevated levels of proliferation in peripheral and central retina to replace the dead cells. (b–c) The central and the peripheral retina immunolabelled with EdU (in purple), at (b) 0‐ and (c) 30‐day chase, in both WT and tert−/−, in young (5 months) and old adults (>30 months in WT and 12 months in tert−/−). Scale bars: 20 μm. Graphs show quantifications of the number of EdU‐retaining cells per area (10,000 μm2), in the overall central and peripheral retina at (b) 0‐ and (c) 30‐day chase. (d) The central retina immunolabelled with GS (Müller glia, in red) after a 3‐day pulse of EdU, by IP injection, at 0‐day chase, in both WT and tert−/−, in young (5 months) and old adults (>30 months in WT and 12 months in tert−/−). Scale bars: 20 μm. Yellow arrows show EdU‐positive cells. (d’) Quantifications of the number of GS‐positive; EdU‐positive cells per area (10,000 μm2). Error bars represent SEM. N = 3–6. (e) Quantifications of the number of EdU‐retaining cells per area (10,000 μm2), per layer of the retina, at 0‐day chase. Error bars represent SEM. N = 3–6

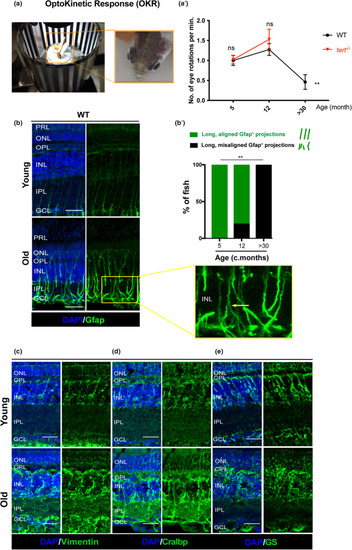
Zebrafish vision declines with ageing, which is accompanied by signs of glial morphological alterations. (a) OKR assay was performed by immobilising the fish in between soft sponges, inside a petri dish containing water, placed in the centre of a rotation chamber. The walls of the rotation chamber had 0.8 mm‐thick black and white stripes and the chamber was maintained at a constant velocity of 12 rpm throughout the experiment. (a’) The number of eye rotations per minute was manually quantified by video observation. Error bars represent the SEM. N = 5–8. (b) MG display signs of altered morphology at old ages, as evidenced by Gfap staining. The central retina immunolabelled with Gfap (in green), in WT, young (5 months) and old adults (>30 months). Yellow arrows highlight an example of aligned versus misaligned MG projections. (b’) Quantifications of the percentage of fish presenting disorganised MG processes in the IPL (detailed view‐inset). N = 6. (c–e) MG in the old retina show altered morphology and altered expression of stress proteins. The central retina immunolabelled with (c) Vimentin, (d) Cralbp, and (e) GS showing disorganised MG in old adults (>30 months) compared with young adults (5 months). N = 6. Scale bars: 20 μm

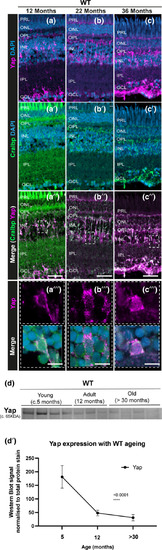
Yap expression is observed in the retinal MG throughout the zebrafish lifespan, but overall levels decrease with ageing. (a–c) The central retina immunolabelled for Yap expression (in magenta) and (a’–c’) Cralbp (MG cells, in green) in WT zebrafish at different ages (c. 12 months, 22 months, and 36 months). (a’’–c’’) Merge of DAPI, Yap and Cralbp staining and (a’’’–c’’’) respective inset showing Yap expression in MG cells at all stages observed. Representative images shown from N = 3 animals per age. Scale bars: 20 μm and 3 μm (in insets). (d–d’) Western blot of whole eyes and respective quantification show decreased Yap expression with ageing in WT zebrafish. N = 3–4

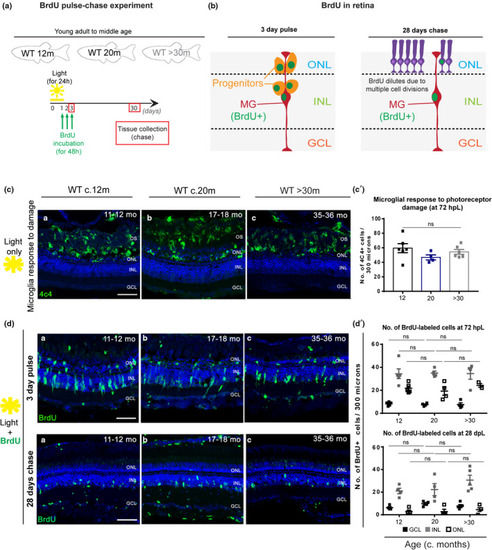
Zebrafish MG regenerative capacity upon acute damage is maintained in old age. (a) Schematic image of the experimental design and (b) expected results. Fish were light‐treated for 24 h and BrdU incorporation occurred between 24–72 h (green), which allowed for BrdU to be washed out the proliferating progenitors, leaving only MG which re‐entered the cell cycle to be labelled. (c) The central retina labelled with 4C4 (microglia, in green), after light treatment, in adults (c. 12 months), middle aged (c. 20 months) and old (>30 months) albino zebrafish. The majority of the microglia response to damage occurs within the OS and ONL of the retina, where a debris field is present due to photoreceptor degeneration. (c’) Quantification of the number of microglial cells which responded to photoreceptor damage in the different aged groups. (d, top) The central retina 72 h after light treatment onset, immunolabelled with BrdU (proliferation, in green). (d’). Quantification of the number of cells proliferating in the GCL (represented in black squares), INL (represented in grey squares), and ONL (represented in white squares) in each age group. (d, bottom) The central retina 28 days after light treatment onset. (d’). Quantification of the number of BrdU‐positive cells observed in the GCL, INL, and ONL of each aged group. Error bars represent the SEM. N = 4–5. Scale bars: 20 μm

Acknowledgments
This image is the copyrighted work of the attributed author or publisher, and ZFIN has permission only to display this image to its users. Additional permissions should be obtained from the applicable author or publisher of the image. Full text @ Aging Cell