
- Title
-
WT1 transcription factor impairs cardiomyocyte specification and drives a phenotypic switch from myocardium to epicardium
- Authors
- Marques, I.J., Ernst, A., Arora, P., Vianin, A., Hetke, T., Sanz-Morejón, A., Naumann, U., Odriozola, A., Langa, X., Andrés-Delgado, L., Zuber, B., Torroja, C., Osterwalder, M., Simões, F., Englert, C., Mercader, N.
- Source
- Full text @ Development
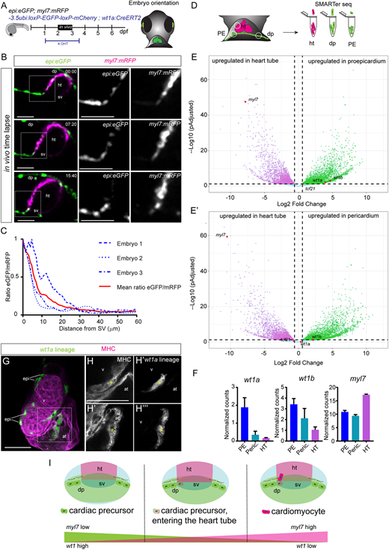
wt1a-positive cells lose eGFP expression upon entering the heart tube. (A) Schematic representation of the in vivo imaging of the developing heart tube. (B) Time-lapse images of the developing heart tube between 52 and 68 h post-fertilization (hpf) in the double transgenic line epi:eGFP;myl7:mRFP. Gray images are single-channel detailed images of the areas outlined in the merged panels. There is an opposite gradual shift in the expression levels between eGFP and RFP over time. (C) Quantification of the ratio of eGFP and mRFP levels in cells of the heart tube according to the distance from the sinus venosus (SV). (D) Schematic representation of tissue dissection for SMARTer-seq of dorsal pericardium, proepicardium and heart tubes of zebrafish embryos. (E,E′) Volcano plots. Magenta dots indicate upregulated genes in the heart tube. Green dots indicate genes upregulated in proepicardium (E) or pericardium (E′). (F) Quantification of normalized counts for the epicardial marker genes wt1a and wt1b, and the myocardial gene myl7. Data are mean±s.d. (G-H‴) Whole-mount immunofluorescence against GFP and myosin heavy chain (MHC) of wt1a:CreErt2;ubi:switch zebrafish embryos, recombined between 24 and 96 hpf. The heart of a 5 days post-fertilization (dpf) embryo is shown. GFP-expressing cells are those derived from wt1a progenitors. (H-H‴) Detailed views of single slices of the region outlined in G. Asterisks indicate cells that co-express GFP and MHC. (I) Schematic representation of the downregulation of eGFP and upregulation of mRFP in cardiomyocyte progenitors upon their entry into the heart tube. Scale bars: 50 µm. dp, dorsal pericardium; ht, heart tube; sv, sinus venosus. |
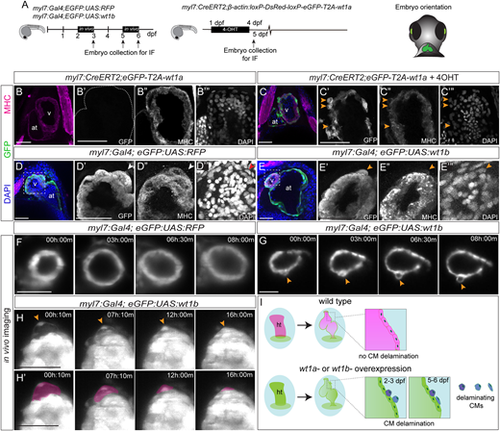
Ventricular cardiomyocytes delaminate from the ventricle and change their fate upon wt1a or wt1b overexpression. (A) Schematic representation of transgenic lines used and position of the embryos for imaging. (B-C‴) Whole-mount immunofluorescence against GFP (green) and MHC (magenta) on myl7:CreERT2,eGFP-T2A-wt1a hearts at 5 days post-fertilization (dpf): non-recombined (B-B‴) and recombined by addition of 4-OHT (C-C‴) between 1 and 4 dpf. Maximum intensity projections of five optical sections with 1.5 µm between two consecutive sections are shown. Arrowheads indicate GFP-positive cardiomyocytes located on the apical myocardial surface, revealing reduced MHC staining. (D-E‴) Whole-mount immunofluorescence against GFP and MHC on a myl7:Gal4;eGFP:UAS:RFP (D-D‴) and a myl7:Gal4;eGFP:UAS:wt1b (E-E‴) embryo at 3 dpf. DAPI was used for nuclear counterstain. Maximum intensity projections of 20 stacks with a distance of 1 µm between two consecutive optical sections of the heart region are shown. (D′-D‴ and E′-E‴) Detailed views of the area of the ventricle indicated in D and E, respectively. Arrowheads indicate a GFP-positive cell that is MHC+ in D′-D‴ and a GFP+/MHC− cell in E′-E‴, and an epicardial cell in the myl7:Gal4;eGFP:UAS:RFP control heart, negative for both GFP and MHC. (F,G) Time-lapse images of the ventricle in a myl7:Gal4;eGFP:UAS:RFP (F) or a myl7:Gal4;eGFP:UAS:wt1b (G) embryo between 2 and 3 dpf. Elapsed time since initial acquisition is indicated in each panel. Arrowheads indicate a cell extruding from the ventricle. (H,H′) Time-lapse images of the ventricle in a myl7:Gal4;eGFP:UAS:wt1b embryo between 5 and 6 dpf. Elapsed time since initial acquisition is indicated in each panel. Delaminating cells change morphology over time and flatten down (arrowheads). In H′, the flattening cells are highlighted in magenta. (I) Model of the delamination process of wt1a or wt1b-overexpressing cardiomyocytes. Scale bars: 50 µm. at, atrium; CM, cardiomyocyte; ht, heart tube; IF, immunofluorescence; v, ventricle. |
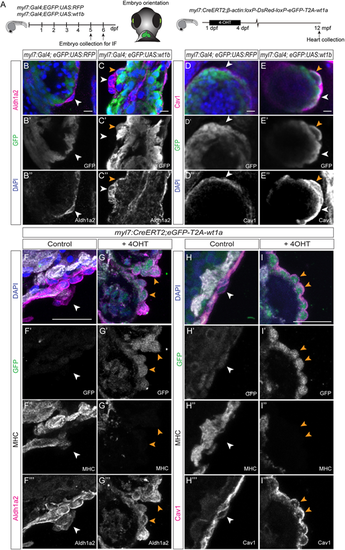
Delaminated wt1a or wt1b-overexpressing cardiomyocytes start to express epicardial markers. (A) Schematic representation of the lines used and the time points during which 4-hydroxytamoxifen (4-OHT) was administered to myl7:CreERT2;β-actin:loxP-DsRed-loxP-eGFP-T2A-wt1a fish (in short, myl7:CreERT2,eGFP-T2A-wt1a), as well as embryo orientation for image acquisition. (B-C″) Whole-mount immunofluorescence against GFP and Aldh1a2 in myl7:Gal4;eGFP:UAS:RFP (B-B″) and myl7:Gal4;eGFP:UAS:wt1b (C-C″) embryos, at 5 days post-fertilization (dpf). Maximum intensity projections of five images with a distance of 1.5 µm between two consecutive optical sections are shown. White arrowheads mark cells positive for Aldh1a2. Orange arrowheads indicate cells that are positive for both GFP and Aldh1a2. Green, GFP; magenta, Aldh1a2; blue, DAPI. (D-E″) Whole-mount immunofluorescence against GFP and caveolin 1 (Cav1) in myl7:Gal4;eGFP:UAS:RFP (D-D″) and myl7:Gal4;eGFP:UAS:wt1b (E-E″) embryos at 6 dpf. Maximum intensity projections of 10 consecutive optical sections with a distance of 1.5 µm between them. White arrowheads highlight epicardial cells positive for Cav1 and negative for GFP. Orange arrowheads indicate epicardial cells that express both Cav1 and GFP. Green, GFP; magenta, Cav1; blue, DAPI. (F-G‴) Immunofluorescence against GFP (green), MHC (white) and Aldh1a2 (magenta) on paraffin wax-embedded sections of myl7:CreERT2;eGFP-T2A-wt1a and myl7:CreERT2;eGFP-T2A-wt1a+4-OHT adult hearts. Detailed views of heart sections in the atrium are shown. Both merged and single channels are shown, as indicated in the panel. White arrowheads indicate cells positive for Aldh1a2 only. Orange arrowheads indicate cells positive for GFP and Aldh1a2 signal that lack MHC staining, and that are located close to the myocardial surface. (H-I‴) Immunofluorescence against GFP (green), MHC (white) and caveolin 1 (Cav1) (magenta) on paraffin wax-embedded sections of myl7:CreERT2;eGFP-T2A-wt1a and myl7::CreERT2;eGFP-T2A-wt1a+4-OHT adult hearts. Detailed views of heart sections in the atrium are shown. Both merged and single channels are shown, as indicated in the panel. White arrowheads indicate cells positive only for Cav1. Orange arrowheads indicate cells positive for GFP and Cav1 signal that lack MHC staining, and that are located close to the myocardial surface. Scale bars: 10 µm in B-E″; 25 µm in F-I‴. Cav1, caveolin 1; MHC, myosin heavy chain. |
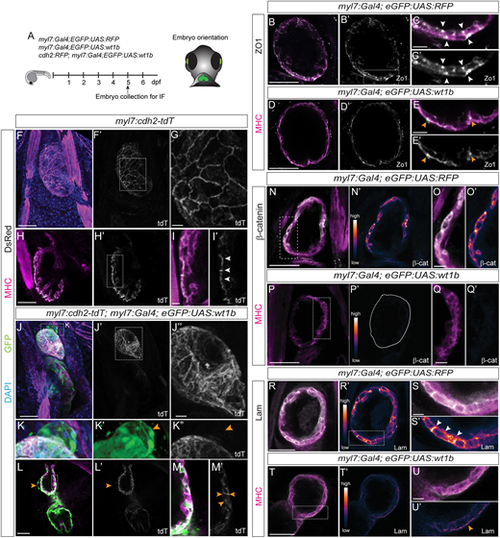
Changes in cell adhesion and cell polarity upon wt1b overexpression in the myocardium. (A) Schematic representation of the lines used, the time of fixation and embryo orientation for imaging. (B-E′) Immunofluorescence against zonula occludens 1 (ZO-1) and myosin heavy chain (MHC) in myl7:Gal4;eGFP:UAS:RFP (B-C′) and myl7:Gal4;eGFP:UAS:wt1b (D-E′) embryos. Sagittal single planes of the ventricle of merged and single channels as marked in the panels. (C,C′ and E,E′) Detailed views of the regions outlined in B′ and D′, respectively. Arrowheads indicate ZO1 signal. (F-M′) Immunofluorescence against tdTomato (tdT) (using a DsRed antibody) and MHC in myl7:cdh2-tdTomato (F-I′) and myl7:cdh2-tdTomato;myl7:Gal4;eGFP:UAS:wt1b (J-M′) embryos. (F-G) 3D projections of a heart. (G) Detailed view of the region outlined in F′. (H-I′) Sagittal single planes of the ventricle. (I,I′) Detailed views of the region outlined in H′. Arrowheads indicate regions with tdT signal. (J-K″) 3D projections of a heart. (J″) Detailed view of the region outlined in J′. (K-K″) Detailed views of the region outlined in J. Arrowheads indicate delaminating cells from the ventricle. tdT signal is not present in the delaminated cells (K″). (L-M′) Sagittal single planes of the ventricle. (M,M′) Detailed views of the region outlined in L. Arrowheads indicate tdT signal. (N-Q′) Immunofluorescence against β-catenin (β-cat) and MHC in myl7:Gal4;eGFP:UAS:RFP (N-O′) and myl7:Gal4;eGFP:UAS:wt1b (P-Q′) embryos. Sagittal single planes of the ventricle of merged and single channels, as indicated in the panels. LUT color shows gradient of β-cat signal intensity. (O,O′ and Q,Q′) Detailed views of the regions outlined in N and P, respectively. Region marked in P′ indicates the ventricle. (R-U′) Immunofluorescence against laminin (Lam) and MHC in myl7:Gal4;eGFP:UAS:RFP (R-S′) and myl7:Gal4;eGFP:UAS:wt1b (T-U′) embryos. Sagittal single planes of the ventricle of merged and single channels, as indicated in the panels. LUT color shows gradient of laminin signal intensity. (S,S′ and U,U′) Detailed views of the regions outlined in R′ and T, respectively. Arrowheads indicate laminin signal. Scale bars: 50 µm in B,B′,D,D′,F,F′,H,H′,J,J′,L,L′,N,N′,P,P′,R,R′,T,T′; 10 µm in C,C′,E,E′,G,I,I′,J″,K-K″,M,M′,O,O′,Q,Q′,S,S′,U,U′. dpf, days post-fertilization; IF, immunofluorescence. |
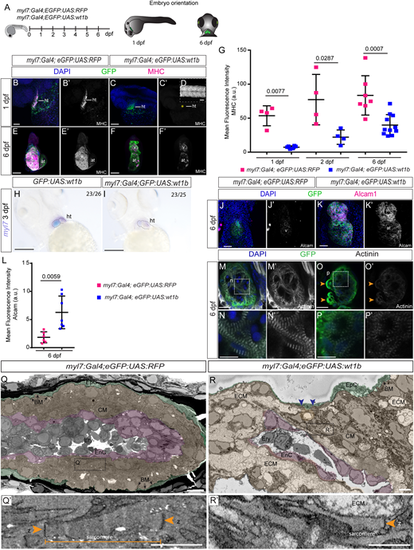
Changes in cardiomyocyte maturation and structure upon wt1b overexpression. (A) Schematic representation of the lines used and embryo orientation for staining and imaging. (B-F′) Immunofluorescence against GFP and myosin heavy chain (MHC) on myl7:Gal4;eGFP:UAS:RFP and myl7:Gal4;eGFP:UAS:wt1b zebrafish embryos. (B-C′) 3D projection of 1 day post-fertilization (dpf) embryos. Lateral views of the cardiac tube. Asterisk in C′ indicates the heart, where MHC is absent. (D) MHC staining of the myotome region of the myl7:Gal4;eGFP:UAS:wt1b embryo. (E-F′) 3D projections of the heart region at 6 dpf. Ventral views are shown; the head is to the top. (G) Quantification of mean fluorescence intensity in the heart region for myl7:Gal4;eGFP:UAS:RFP and myl7:Gal4;eGFP:UAS:wt1b zebrafish, at indicated developmental stages. Statistical significance was calculated by an unpaired t-test with Welch's correction (24 hpf) and by unpaired t-test for the remaining group comparisons. Data are mean±s.d. with each point representing a single biological replicate. (H,I) Whole-mount mRNA in situ hybridization against myl7 mRNA in (H) eGFP:UAS:wt1b and (I) myl7:Gal4;eGFP:UAS:wt1b zebrafish embryos at 3 dpf. Embryos are positioned ventrally, with the head towards the top. (J-K′) Immunofluorescence against GFP and Alcam on myl7:Gal4;eGFP:UAS:RFP and myl7:Gal4;eGFP:UAS:wt1b zebrafish embryos. 3D projections of the heart region in a 6 dpf larva (ventral views; the head is towards the top). (L) Quantification of mean fluorescence intensity of anti-Alcam staining as shown in J-K′. Statistical significance was calculated using an unpaired t-test with Welch's correction. Data are mean±s.d. with each point representing a single biological replicate. (M-P′) Immunofluorescence against GFP and α-actinin. Maximum intensity projections of two consecutive optical sections with a step size of 1.5 µm of the ventricle of myl7:Gal4;eGFP:UAS:RFP (M-N′) and myl7:Gal4;eGFP:UAS:wt1b (O-P′) at 6 dpf. (N,N′ and P,P′) Maximum intensity projections regions outlined in M and O, respectively. (Q-R′) Serial block face scanning electron microscope images of zebrafish hearts. Single sections of myl7:Gal4;eGFP:UAS:RFP (Q,Q′) and myl7:Gal4;eGFP:UAS:wt1b (R,R′) hearts are shown. Different cell layers are highlighted with colors. (Q′ and R′) Detailed views of the areas outlined in Q and R highlighting sarcomeres. Green labels the epicardium; magenta marks the endocardial layer; orange/brown highlights the myocardium. Orange arrowheads indicate z-bands; blue arrowheads indicate basement membrane delimiting epicardium and myocardium. Scale bars: 50 µm in B-F′,H-M′,O,O′; 1 µm in Q,R; 500 nm in Q′,R′; 10 µm in N,N′,P,P′. at, atrium; BM, basement membrane; CM, cardiomyocyte; ECM, extracellular matrix; EnC, endothelial cell; EpC, epicardial cell; Ery, erythrocyte; v, ventricle; z, z-line. Green, GFP; magenta, MHC, Alcam; blue, DAPI. |
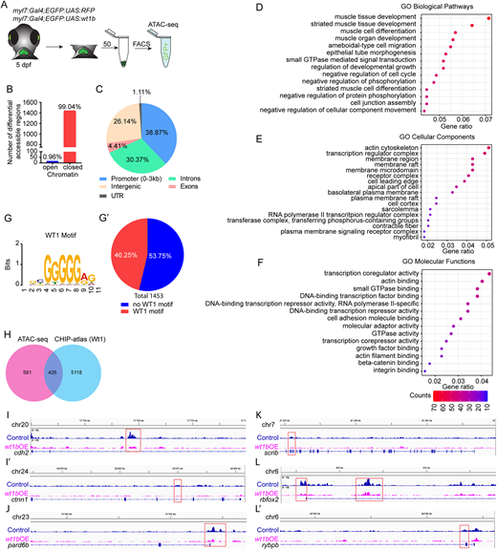
Assay for transposase-accessible chromatin sequencing (ATAC-seq) in wt1b-overexpressing cardiomyocytes. (A) Schematic representation of cell acquisition for ATAC-seq. (B) Graphical representation of number of differential accessible regions between myl7:Gal4;eGFP:UAS:RFP and myl7:Gal4;eGFP:UAS:wt1b cardiomyocytes at 5 days post-fertilization (dpf). (C) Distribution of the genomic regions with differential accessible regions. (D-F) Gene ontology (GO) pathway enrichment for differential accessible regions in cardiomyocytes after wt1b overexpression. (D) Selected GO biological pathway enrichment out of the top 25. (E) Selected GO cellular components enrichment out of the top 25. (F) Selected GO molecular functions enrichment out of the top 25. The color scale indicates the number of genes enriched in a pathway. All pathways have enrichments significance P-adjust ≤0.05. (G,G′) MEME-Centrimo Wt1 motif analysis. (G′) Percentage of the differential accessible regions in which the Wt1 motif is represented. (H) Venn diagram comparing the number of differential accessible regions that are common between the ATAC-seq and the CHIP-atlas database for Wt1. (I-L′) Sequencing tracks for genes with differential peaks within their genomic loci. Genes representing the following are shown: adherens junctions, cdh2 (I) and ctnn1 (I′); apical polarity, pard6b (J); basal polarity, scrib (K); and sarcomere assembly, rbfox2 (L) and rybpb (L′). |